Portfolio Tracker
Dividend Tracker
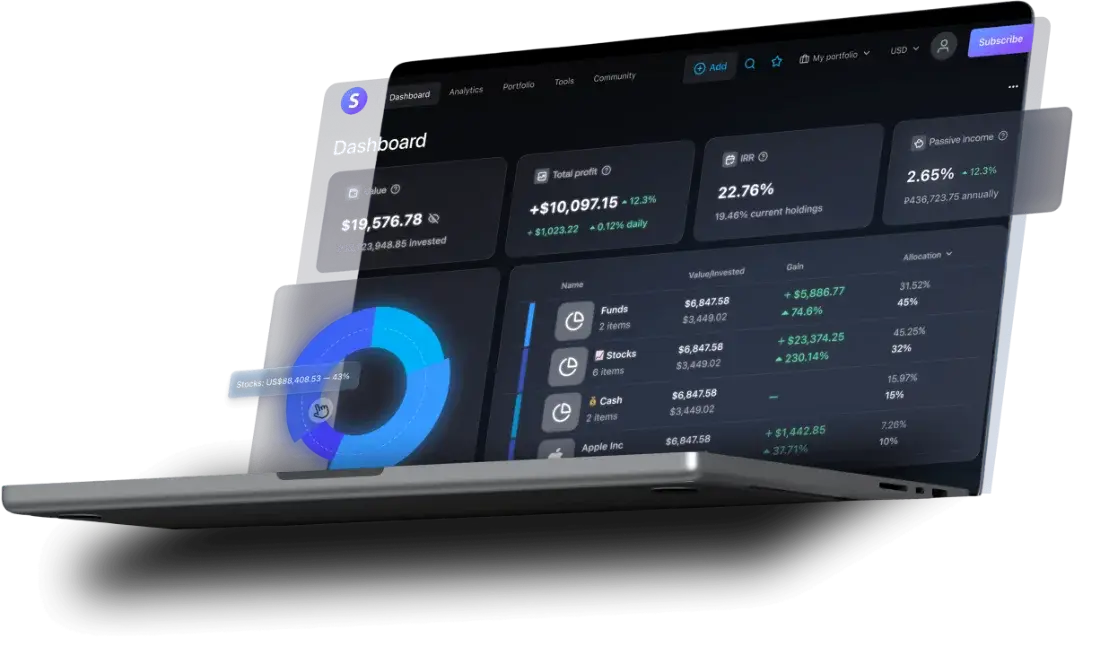
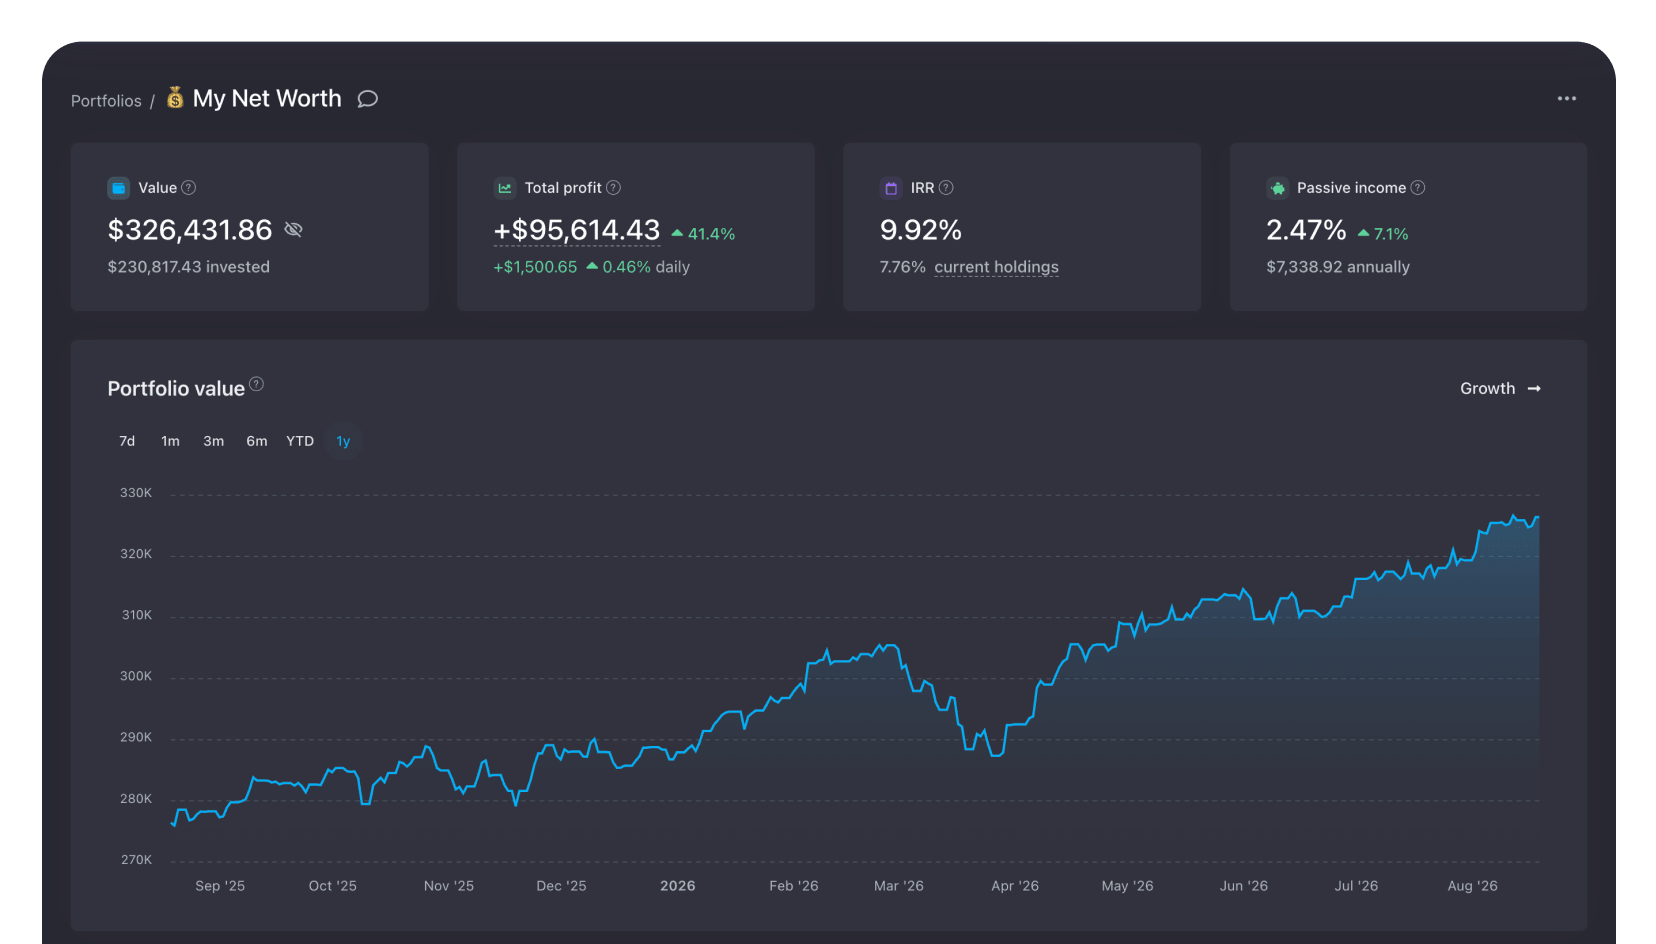
Snowball Analytics portfolio tracker dashboard with portfolio value, returns, IRR and allocation
★★★★★
4.8 on the App Store & Google Play · 7,000+ ratings

The portfolio tracker that simplifies your wealth

No more spreadsheets, no more guesswork. One accurate picture of your allocation, true performance (TWR/IRR), and net worth — synced automatically from 1,000+ brokerages
14-day full access
No credit card
1,000+
BROKERS
70+
EXCHANGES
7,000+
app ratings
Snowball Analytics portfolio tracker dashboard with portfolio value, returns, IRR and allocation
1,000+
BROKERS
70+
EXCHANGES
7,000+
app ratings
★★★★★
4.8 on the App Store & Google Play
The portfolio tracker that simplifies your wealth
No more spreadsheets, no more guesswork. One accurate picture of your allocation, true performance (TWR/IRR), and net worth — synced automatically from 1,000+ brokerages
14-day full access
No credit card
What is Snowball Analytics? Snowball Analytics is a comprehensive portfolio tracker and wealth management platform for investors. It automates portfolio monitoring across 1,000+ brokers and 70+ exchanges — analyzing true investment performance (TWR/IRR), tracking asset allocation, and generating precise financial reports and future net worth forecasts. Plans start free; paid plans run from $7.99/month.
Category: Finance app
Best for: serious retail & FIRE investors
Brokers: 1,000+
Exchanges: 70+
Price: Free – $24.99/mo
Rating: 4.8★ (7,000+)
Platforms: Web, iOS, Android
1,000+ INTEGRATIONS

Sync your entire net worth automatically or import in seconds

Snowball Analytics connects seamlessly with major US and international brokerages through Plaid, Yodlee, and SnapTrade — or lets you drag-and-drop statements easily.
Fidelity logo
Fidelity
Auto-Sync
Charles Schwab logo
Charles Schwab
Auto-Sync
Vanguard logo
Vanguard
Auto-Sync
Interactive Brokers logo
Interactive Brokers
Auto-Sync
Robinhood logo
Robinhood
Auto-Sync
E*TRADE logo
E*TRADE
Auto-Sync
Webull logo
Webull
Auto-Sync
Merrill Edge logo
Merrill Edge
Auto-Sync
M1 Finance logo
M1 Finance
Auto-Sync
SoFi logo
SoFi
Auto-Sync
TradeStation logo
TradeStation
Auto-Sync
Ally Invest logo
Ally Invest
Auto-Sync
Wealthfront logo
Wealthfront
Auto-Sync
Chase logo
Chase
Auto-Sync
Trading 212 logo
Trading 212
Auto-Sync
Fidelity logo
Fidelity
Auto-Sync
Charles Schwab logo
Charles Schwab
Auto-Sync
Vanguard logo
Vanguard
Auto-Sync
Interactive Brokers logo
Interactive Brokers
Auto-Sync
Robinhood logo
Robinhood
Auto-Sync
E*TRADE logo
E*TRADE
Auto-Sync
Webull logo
Webull
Auto-Sync
Merrill Edge logo
Merrill Edge
Auto-Sync
M1 Finance logo
M1 Finance
Auto-Sync
SoFi logo
SoFi
Auto-Sync
TradeStation logo
TradeStation
Auto-Sync
Ally Invest logo
Ally Invest
Auto-Sync
Wealthfront logo
Wealthfront
Auto-Sync
Chase logo
Chase
Auto-Sync
Trading 212 logo
Trading 212
Auto-Sync
Automated Daily Sync
Your holdings, asset values, trades, and cash balances update automatically with no manual maintenance required
File & Spreadsheet Import
Import trading history easily using CSV or Excel files if your brokerage or country is not supported via API
Read-Only Encryption
Encrypted connections via Yodlee, Plaid and SnapTrade. Connections are strictly read-only

Portfolio tracking, automated

Connect your accounts once and Snowball Analytics builds your complete wealth dashboard. No spreadsheets, no manual entry, no fragmented data.
Broker list for connecting a brokerage account to Snowball Analytics

Automated brokerage sync

Drop the manual data entry. Connect securely via Plaid, Yodlee, or SnapTrade, and we automatically pull in your trade history, detect every asset, and organize your portfolio.
Supports 1,000+ global brokerages
Consolidate unlimited accounts
Secure, read-only connections

Wealth projection & forecasting

See the future of your capital. Our forecasting engine projects your portfolio growth, dividend income, and compound interest over the next 10 to 30 years.
Compound growth visualization
Accurate future value projections
Customized growth rate inputs
Portfolio growth and dividend income projection over 30 years
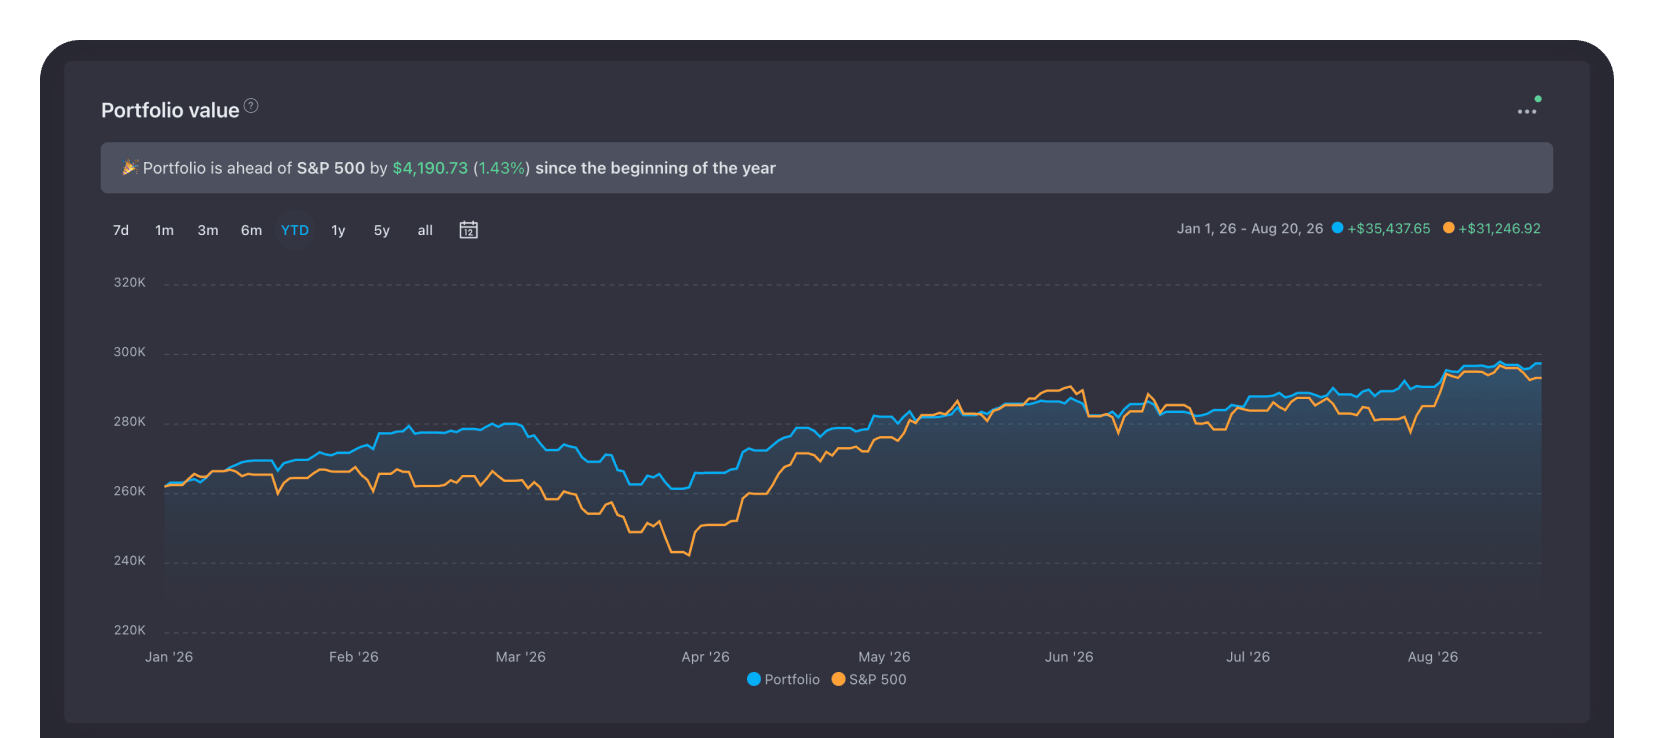
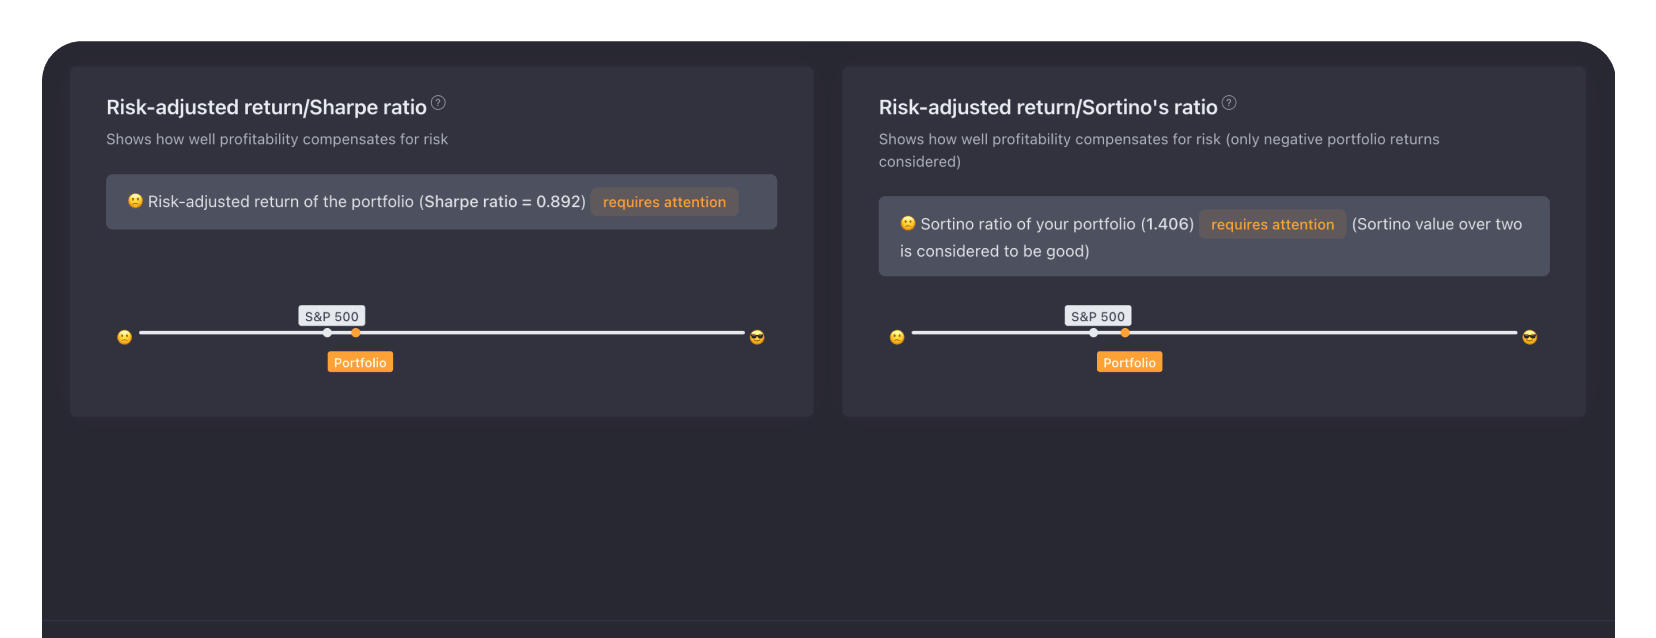
Portfolio performance chart compared with a benchmark
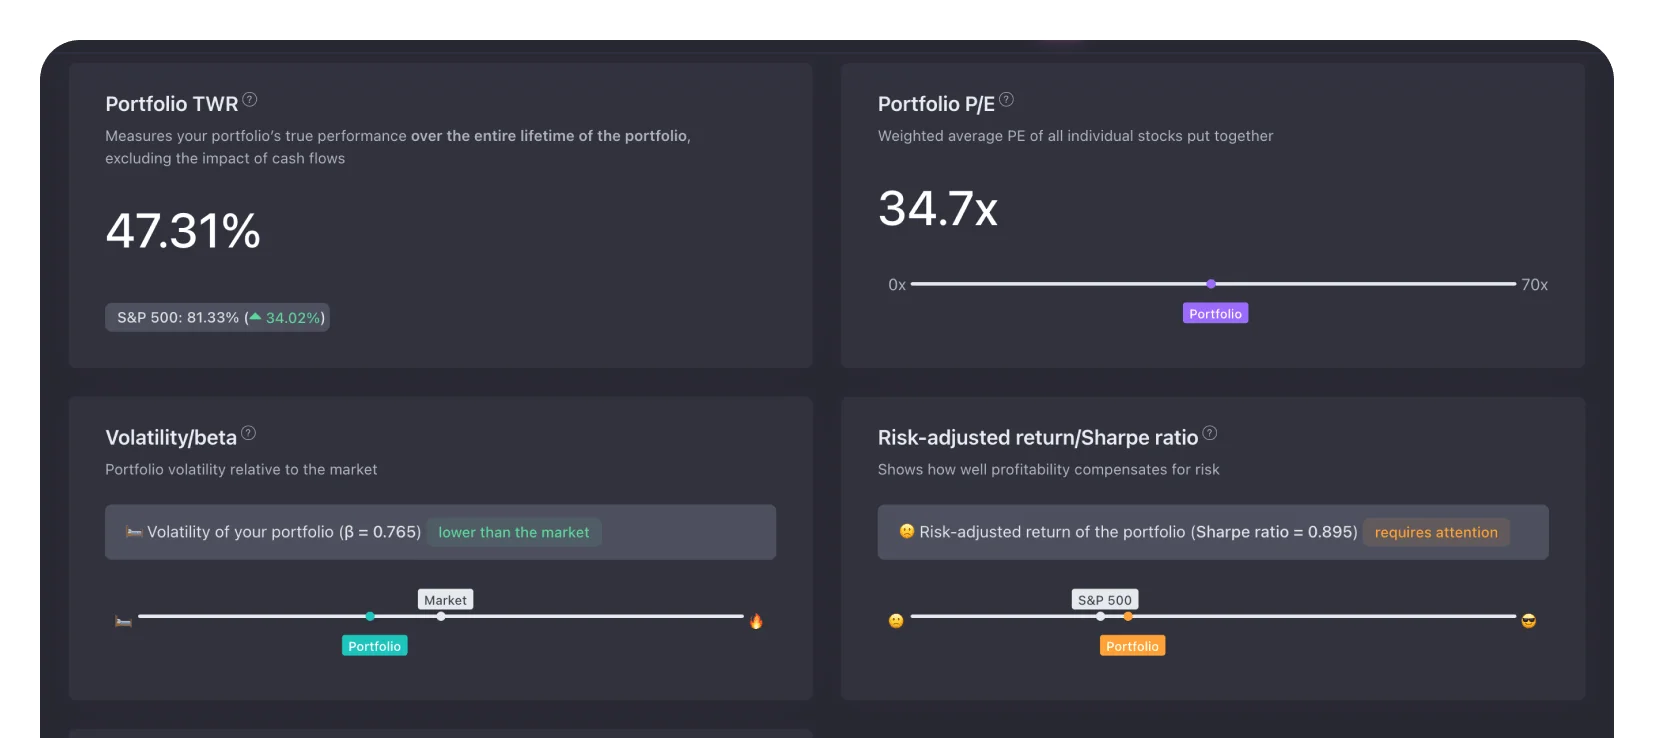
Time-weighted and money-weighted return report
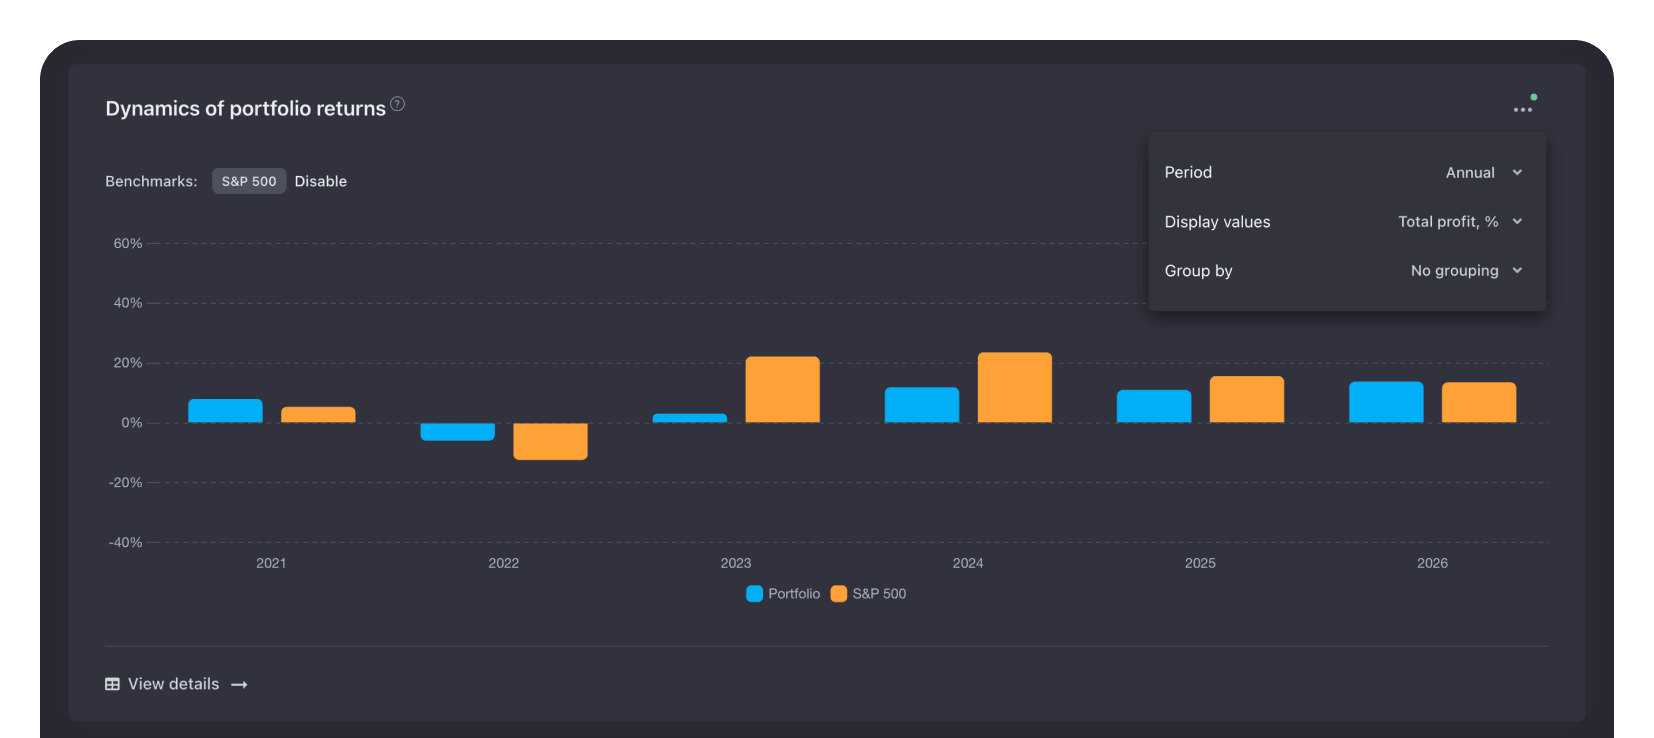
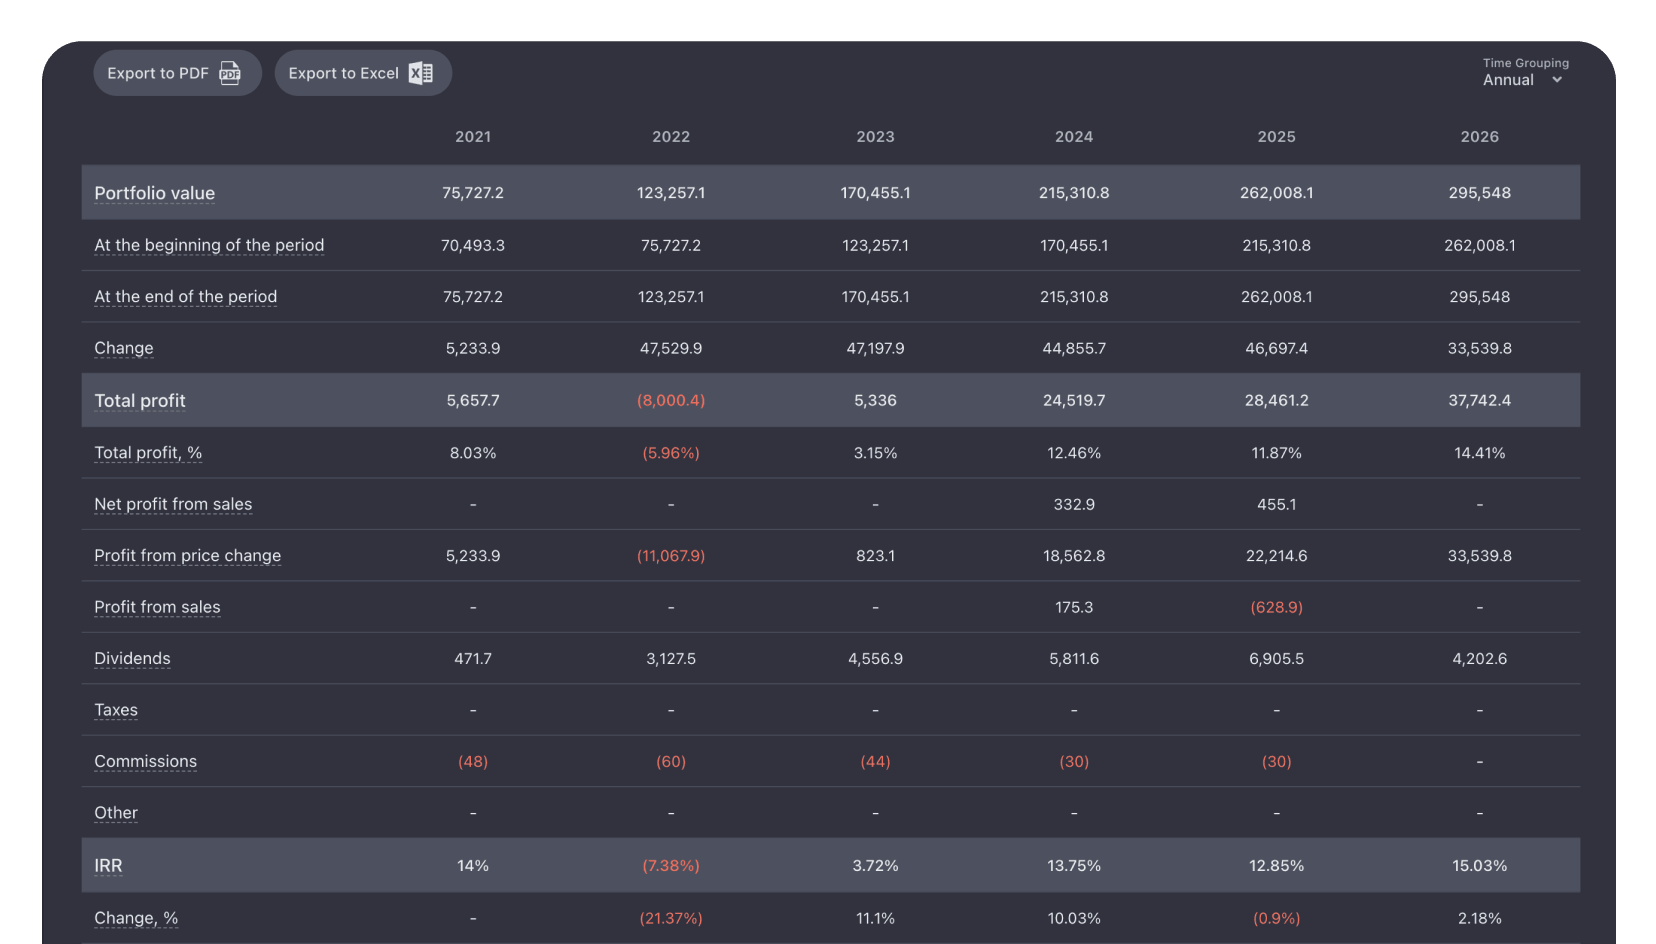
Portfolio performance report by period

True performance & advanced reporting

Go beyond simple price changes. Snowball Analytics calculates your actual returns, factoring in deposits, withdrawals, fees, and dividends, delivered in professional reports.
Time-Weighted Return (TWR)
Internal Rate of Return (IRR)
Benchmark comparisons (e.g. S&P 500)

Net worth & FIRE tracking

Set custom targets for your total net worth and passive income. Watch your portfolio grow and see exactly how close you are to financial independence.
Track net worth milestones
Monitor passive income coverage
Visual progress bars on your dashboard
Net worth and FIRE goal progress on the dashboard
Passive income coverage towards a FIRE target
Stock and ETF screener with performance and fundamental filters

Global asset screener

Discover your next investment. Filter equities, ETFs, and REITs across global exchanges using criteria tailored for serious investors.
Filter by performance and fundamentals
Search 70+ global exchanges
Find growth and value stocks

Asset allocation & risk analysis

Maintain a perfectly balanced portfolio. Visualize your exposure across sectors, industries, and geographies to ensure your wealth is protected.
Sector and asset class breakdown
Holding concentration limits
ETF underlying holdings lookthrough
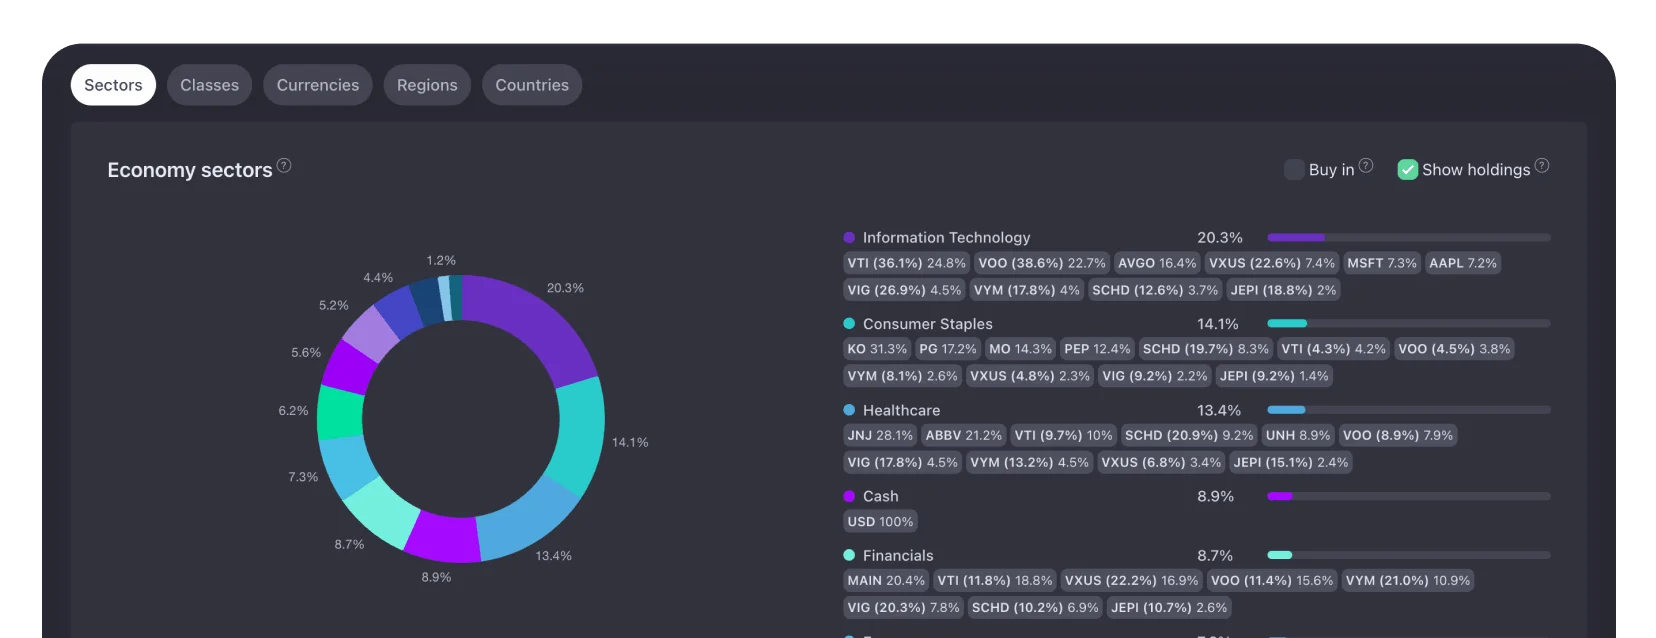
Asset allocation breakdown by sector, country and asset class
Rebalancing tool with target and current weights

Rebalancing

Keep your portfolio perfectly balanced without daily monitoring. Get notified when your asset allocation drifts from your target weights or when it's time to utilize the rebalancing tool.
Asset allocation drift
Rebalancing calculator
Portfolio Lab
Portfolio performance report by period
Net worth and FIRE goal progress on the dashboard
Passive income coverage towards a FIRE target
Asset allocation breakdown by sector, country and asset class
Time-weighted and money-weighted return report
Portfolio performance chart compared with a benchmark

Analyze your entire wealth in one place

Everything you need to track, optimize, and grow your investment portfolio.
Consolidated Dashboard
Merge unlimited brokerages, retirement
accounts, and manual assets into one
unified, easy-to-read financial dashboard.
TWR & IRR Calculations
Track the real performance of your long-term holdings with accurate Time-Weighted and Money-Weighted return formulas.
Desktop only
Advanced Rebalancing
Set target weights for your asset allocation and let the system calculate exactly what to buy or sell to restore balance.
Snowball Analytics vs. a spreadsheet vs. your broker app
Why modern investors switch from spreadsheets to automatic portfolio tracking
Capability
DIY spreadsheet
Basic broker app
Snowball Analytics
Auto-sync multiple brokers
One broker
Advanced performance (TWR & IRR)
Partial
Asset allocation & risk analysis
Manual
Global assets & exchanges
Manual
70+ exchanges
Dividend & income tracking
Manual
Custom watchlists & backtests
Basic
Upkeep time each month
Hours
n/a
Minutes

Rated by thousands of investors

Start free for 14 days with full access. Keep the Free plan forever — no credit card, ever.
4.7
Excellent
561 reviews on Trustpilot
5-star
79%
4-star
11%
3-star
3%
2-star
2%
1-star
4%
See all reviews →

Level of support is exemplary and all personnel strive to provide prompt responses

Jim ProhaskaUnited States · Trustpilot

Timely replies to my technologically challenged questions.

MichaelAustralia · Trustpilot

Great support!

Magnificent tracker, has it all.

JimmyIsrael · Trustpilot

The service Eli provided was absolutely outstanding! I emailed customer support and I got a response with him 10 minutes, Eli worked with me on my issue and resolved it quickly. Thank you very much for all the help Eli!!

Cory TellevikUnited States · Trustpilot

Snowball customer service

Start with a product that solved so many portfolio management issues i was dealing with then add great customer service and you have a home run. I highly recommend Snowball Analytics to anyone managing their own investment portfolios.

David CharltonUnited States · Trustpilot

Very quick response to any questions. Really enjoying the user experience so far.

LeeAustralia · Trustpilot

Great tool to follow up your dividends. Support works great, issues get solved immediately.

Kim BBelgium · Trustpilot

Top notch platform and service!

MateuszPoland · Trustpilot

Great! Enjoy following my two portfolios

Uati Maloata MalomanaUnited States · Trustpilot

Great support & responsive too

The MCP plugin allowing Claude to do deeper summaries works really well

Simon CromptonKenya · Trustpilot
Simple pricing for every investor

Start free for 14 days with full access. Keep the Free plan forever — no credit card, ever.
Free
For beginners & index investors
$
0
forever
No card required

1 portfolio · 10 holdings
Stocks, ETFs & funds
Dividend tracking
Import broker reports
Free plan, always
Starter
For ambitious investors getting serious
$
6.67
/mo
$79.99 billed annually · save $16

Everything in Free, plus:
Unlimited holdings
Link your brokerage (auto-sync)
Advanced rebalancing
Performance analytics
14-day free trial · no card
Investor
For established investors who want it all
$
12.50
/mo
$149.99 billed annually · save $30

Everything in Starter, plus:
10 portfolios · 10 watchlists
Full benchmarking vs any asset
Portfolio reports
30+ years of backtests
14-day free trial · no card
★ Most popular
Expert
For large portfolios — no limits
$
20.83
/mo
$249.99 billed annually · save $50

Everything in Investor, plus:
Unlimited portfolios
Unlimited custom holdings
20 watchlists
14-day free trial · no card
Free
For beginners & index investors
$
0
forever
No card required

1 portfolio · 10 holdings
Stocks, ETFs & funds
Dividend tracking
Import broker reports
Free plan, always
Starter
For ambitious investors getting serious
$
7.99
/mo
$7.99/mo · billed monthly ·
or get 2 months free annually
Everything in Free, plus:
Unlimited holdings
Link your brokerage (auto-sync)
Advanced rebalancing
Performance analytics
14-day free trial · no card
Investor
For established investors who want it all
$
14.99
/mo
$14.99/mo · billed monthly ·
or get 2 months free annually
Everything in Starter, plus:
10 portfolios · 10 watchlists
Full benchmarking vs any asset
Portfolio reports
30+ years of backtests
14-day free trial · no card
★ Most popular
Expert
For large portfolios — no limits
$
24.99
/mo
$24.99/mo · billed monthly ·
or get 2 months free annually
Everything in Investor, plus:
Unlimited portfolios
Unlimited custom holdings
20 watchlists
14-day free trial · no card
No lock-in. Upgrade or downgrade whenever you like. We never delete your data.

Explore the Snowball Analytics ecosystem

Dive deeper into the tools behind the tracker — from stock analysis to dividend planning
Your portfolio dashboard, anywhere
Take control of your investments with the Snowball Analytics mobile app. Everything you love about the web tracker, fully optimized for your smartphone.
Download Snowball Analytics on the App Store
★★★★★
4.8
4,600 ratings
Get Snowball Analytics on Google Play
★★★★★
4.8
2,500 ratings
Home screen widgets for portfolio, performance, and gainers
Push notifications for market events
Track your FIRE progress and net worth goals
Deep dive into asset allocation & risk analytics
Secure, automated brokerage sync on the go
Dividend tracker
Automatically track payouts, calculate Yield on Cost, and project future passive income.
Dividend rating
Avoid yield traps. Analyze financial health, payout ratio and sustainability.
Stock tracker
Monitor individual equities, price movements and 10-year company fundamentals.
Dividend calendar
See exactly when payouts hit your account across all global holdings.
Dividend calculator
Project future passive income, simulate DRIP scenarios and visualize compounding.
Ex-dividend calendar
Plan trades around upcoming ex-dividend dates to capture the next payout.

How to track your stock portfolio in one place

A portfolio tracker pulls your holdings, trades and dividends from every brokerage account into one dashboard. Then it works out what a broker app usually won't show you, starting with your real return across all accounts. You also see where your money is concentrated and how much income the portfolio pays. Snowball Analytics does this for stocks, ETFs, mutual funds and custom assets on 70+ exchanges.

What a stock portfolio tracker should show you

Start with the basics. Every position belongs in one list, with its current value and your gain or loss on it. Dividends belong in the same view, because for a long-term investor they are part of the return.

The harder questions come next. How did the whole portfolio do once your deposits are taken out? How much of it sits in tech, or in one country? Which companies do your ETFs hold twice? A good tracker answers these without a spreadsheet.

Tracking several brokerage accounts together

Most investors end up with more than one account: a main brokerage account, a retirement account, maybe an old one at a second broker. Looking at them one by one hides the total.

Snowball Analytics connects to 1,000+ brokers through Plaid, Yodlee and SnapTrade, including Interactive Brokers, Charles Schwab, Vanguard, Fidelity and Robinhood. Connected accounts update automatically every day. If your broker isn't supported, upload the trade history as a CSV or Excel file. Holdings in different currencies can live in one portfolio; 30+ currencies are supported for tracking.

Measuring performance: time-weighted vs money-weighted return

Your account balance is a poor scorecard. It grows every time you add money, even in a month when your picks lost value.

Time-weighted return (TWR) removes the effect of deposits and withdrawals. It shows how the investments themselves performed, so it is the figure to compare with an index such as the S&P 500 or NASDAQ.

Money-weighted return, calculated as an internal rate of return (IRR), takes the timing of your cash into account. Invest a large sum just before a drop and IRR will show the damage; TWR won't. The two answer different questions, which is why Snowball Analytics shows both, with dividends and fees included.

Tracking dividends and passive income

For income investors the useful view looks forward. Snowball Analytics records every payout, shows yield on cost for each holding and puts upcoming payments on a dividend calendar. The dividend calculator projects future income and models dividend reinvestment (DRIP).

Portfolio tracker vs spreadsheet vs broker app

A spreadsheet is free and fully under your control. It also needs a manual entry for every trade and dividend, and TWR and IRR formulas are easy to get subtly wrong.

A broker app is accurate for that one broker. It can't see your other accounts, so your total allocation and return stay out of view.

A dedicated tracker sits on top of both. You keep your brokers. The tracker reads from them and adds the analysis.

Allocation, ETF overlap and rebalancing

Owning five ETFs can mean owning the same large companies five times. ETF look-through breaks each fund into its underlying holdings, so you see your real exposure by company, sector and country.

Keep target weights? The rebalancing tool compares them with your current allocation. It then calculates the trades that would bring the portfolio back to target, and whether to place them is your call.

Free and paid portfolio trackers

Many trackers start free, so check the limits before you import years of history. The Free plan in Snowball Analytics covers 1 portfolio with up to 10 holdings, dividend tracking and broker report import, with no time limit. Paid plans start at $7.99 a month and add automatic broker sync, unlimited holdings and performance analytics. Every new account gets 14 days of full access, no card required.

How to start tracking your portfolio

Create a free account on the web, iOS or Android. Connect a broker, or upload a statement if yours isn't supported. When the history is in, check that the positions match your broker statement. Then pick a benchmark and, if you use them, set target weights. That is enough to see your first true return figure.

Frequently asked questions

What is Snowball Analytics?

Snowball Analytics is a portfolio tracker for long-term investors. It brings every brokerage account into one dashboard and calculates your real return with time-weighted (TWR) and money-weighted (IRR) methods. It also tracks dividends, shows asset allocation and projects how your net worth could grow. It runs on the web, iOS and Android.

Is Snowball Analytics a free portfolio tracker?

There is a Free plan with no time limit: 1 portfolio, up to 10 holdings, dividend tracking and broker report import. Paid plans start at $7.99 a month, or $79.99 a year, and add automatic broker sync and unlimited holdings.

Every new account gets 14 days of full access first, and no credit card is needed. See all limits on the pricing page.

Which brokers does Snowball Analytics support?

Over 1,000 brokers connect through Plaid, Yodlee and SnapTrade. That includes Interactive Brokers, Charles Schwab, Vanguard, Fidelity, Robinhood, E*TRADE and Webull. If your broker is missing, export your trade history and import it as a CSV or Excel file, or add trades by hand.

How often does my portfolio update?

Once a day. Connected accounts sync automatically, so new trades, dividends and cash show up without you doing anything.

Market data comes from EODHD. Prices on the site are not real-time and can lag the exchange (for a long-term investor checking weekly, that rarely matters).

Can I track international stocks and different currencies?

Yes. The database covers stocks, ETFs, ADRs and funds on 70+ exchanges, and 30+ currencies are supported for tracking. A US brokerage account and a European one can sit in the same portfolio.

Can I keep several portfolios?

Yes, depending on the plan. The Investor plan holds 10 portfolios and 10 watchlists; Expert has no limit on portfolios. Some people keep a separate dividend portfolio next to their long-term one.

How do I compare my portfolio with the S&P 500?

Pick a benchmark, such as the S&P 500, NASDAQ or a single ETF. Snowball Analytics then draws your time-weighted return against it over the same period, with dividends and fees included. On the Investor plan you can benchmark against any asset in the database.

Can I backtest a portfolio?

Yes, on the Investor and Expert plans. Backtests run on more than 30 years of history. Try a mix of stocks and ETFs on paper first, and see how it would have behaved through past drops. Past results are no guarantee of future returns, of course.

Is there a portfolio tracker app for iPhone and Android?

Yes. The Snowball Analytics app is on the App Store and Google Play, rated 4.8 in both. It has home screen widgets for portfolio value and top movers, push notifications for market events, and the same data as the web version.

Is it safe to connect my brokerage account?

Connections run through Plaid, Yodlee and SnapTrade and are read-only. Snowball Analytics can read positions and transactions; it cannot place trades or move money. Your data is encrypted, and the service follows GDPR.

Can I track my net worth and FIRE goal?

Yes. Set a target for net worth or passive income, and the dashboard shows your progress. The projection tool estimates when you could reach the target, based on your current portfolio and the growth rate you enter. It is arithmetic on your inputs, not a forecast of the market.

Can I see the stocks inside my ETFs?

Yes. ETF look-through opens every fund you own. Two S&P 500 funds plus a tech ETF can turn out to be the same big companies, counted three times.

Can I switch plans later?

Any time. There is no lock-in, and your data stays put when you change plans.

Take control of your portfolio today
Get full access free for 14 days, then keep the Free plan forever. No credit card. No commitment.
Encrypted · read-only access · GDPR