The Snowball Analytics
S&P 500 Calculator
Model real historical S&P 500 returns from 1970 to 2025. Reinvest dividends (DRIP), adjust for CPI inflation, step up your contributions, and calculate real purchasing power over time.
The S&P 500 calculator helps you work out:
Historical Real Returns
Actual 1970–2025 S&P 500 performance adjusted for CPI inflation erosion.
DRIP Compounding Effect
How reinvesting dividends changes long-term results.
Dollar-Cost Averaging
Impact of regular periodic contributions (DCA) over market cycles.
Nominal vs. Inflation-Adjusted
Compare raw total wealth against real purchasing power in today's dollars.
Ending Balance
Total Contributed
Investment Gains
Real Value
S&P 500 Index Performance Summary (2010 - 2025)
Investor Milestones
Illustrative calculation using S&P 500 calendar-year returns for 2010–2025, with dividends reinvested. Monthly contributions of $200 at the start of each period, assumed to grow evenly within each year. Index returns are before fees and expenses, and the index cannot be bought directly. Past performance does not guarantee future results. This is arithmetic, not a forecast or advice. Investments can lose value.
Pro-Tips for Long-Term Investors
Ideas for long-term index investors to keep compounding on track.
Enable Dividend Reinvestment
In this calculator's data, reinvested dividends account for about three quarters of the total gain over 1976–2025. A dividend reinvestment plan (DRIP) can automatically buy fractional shares, often without commission, depending on your broker.
Automate Dollar-Cost Averaging
Instead of trying to time the market, you can contribute a fixed amount on a schedule (dollar-cost averaging). Regular purchases buy more shares when prices are lower and fewer when they are higher, which smooths your average cost but does not remove the risk of loss.
Minimize Expense Drag
Evaluate returns in real, inflation-adjusted terms. Fees reduce what you keep: this calculator uses index returns before fees, so a fund's expense ratio comes on top. Low-cost index funds keep more of the return, and expense ratios are published by each fund provider.
Explore Top Investing Concepts
Understand how long-term wealth accumulators leverage compounding structures
Tickers are examples for illustration only, not recommendations or advice.
More Financial Tools & Calculators
Optimize your portfolio further with our specialized long-term planning tools.
Dividend Calculator
Project future dividend payouts, simulate DRIP plans, and calculate your Yield on Cost.
Compound Interest Calculator
Simulate daily compound growth, model savings timing, tax drag, inflation, and volatility.
Retirement Calculator
Plan your post-career nest egg, track spending thresholds, and build income runways.
FIRE Calculator
Calculate your Financial Independence number and predict when you can retire early.
Explore the Snowball Analytics ecosystem
Dive deeper into the tools behind the tracker — from stock analysis to dividend planning
Dividend tracker
Automatically track payouts, calculate Yield on Cost, and project future passive income.
Explore dividend tracker →Dividend rating
Avoid yield traps. Analyze financial health, payout ratio and sustainability.
Check dividend ratings →Stock tracker
Monitor individual equities, price movements and 10-year company fundamentals.
Explore stock tracker →Dividend calendar
See exactly when payouts hit your account across all global holdings.
View dividend calendar →Dividend calculator
Project future passive income, simulate DRIP scenarios and visualize compounding.
Try dividend calculator →Ex-dividend calendar
See upcoming ex-dividend and payment dates for your holdings.
View ex-dividend dates →S&P 500 Calculator with Historical Returns, Dividends and CPI
Many calculators use a flat rate such as 10% a year. This one uses the S&P 500's actual calendar-year returns, the dividend portion of each year's return and U.S. CPI inflation from 1970 to 2025, so the order of good and bad years matters. It is an illustration based on past data, not a forecast.
How This Calculator Compares with DQYDJ and Official Data
A look at what each free S&P 500 calculator offers, based on what the tools show publicly.
| Feature | Snowball Analytics | DQYDJ Return Calculator | DQYDJ Periodic Reinvestment | Official Data |
|---|---|---|---|---|
| Return data and period | Calendar years, 1970–2025 | Monthly averages | Monthly | Monthly averages, by year |
| Regular contributions | Weekly to annual, start or end of period | ✕ lump sum only | Monthly | Shows a monthly DCA result |
| Dividends reinvested or kept as cash | Toggle | Shows price and total return | Reinvested | |
| Inflation-adjusted (CPI) view | ||||
| Taxes | One rate on gains and dividends | ✕ | Separate dividend and capital gains tax | ✕ |
| Management fees | ✕ | ✕ | ✕ | |
| Contributions that grow over time | Step-up % a year | ✕ | By inflation or x% a month | ✕ |
| Data download or table | CSV | ✕ | CSV | Monthly table on page |
Compared in October 2026 using the public versions of the DQYDJ S&P 500 Return Calculator, the DQYDJ S&P 500 Periodic Reinvestment Calculator and Official Data. ✕ means the feature is not shown among the tool's inputs. DQYDJ and Official Data work with monthly data, which is more detailed than the calendar-year returns used here. Tools change over time, so check each one for current details.
Frequently Asked Questions
Your portfolio dashboard, anywhere
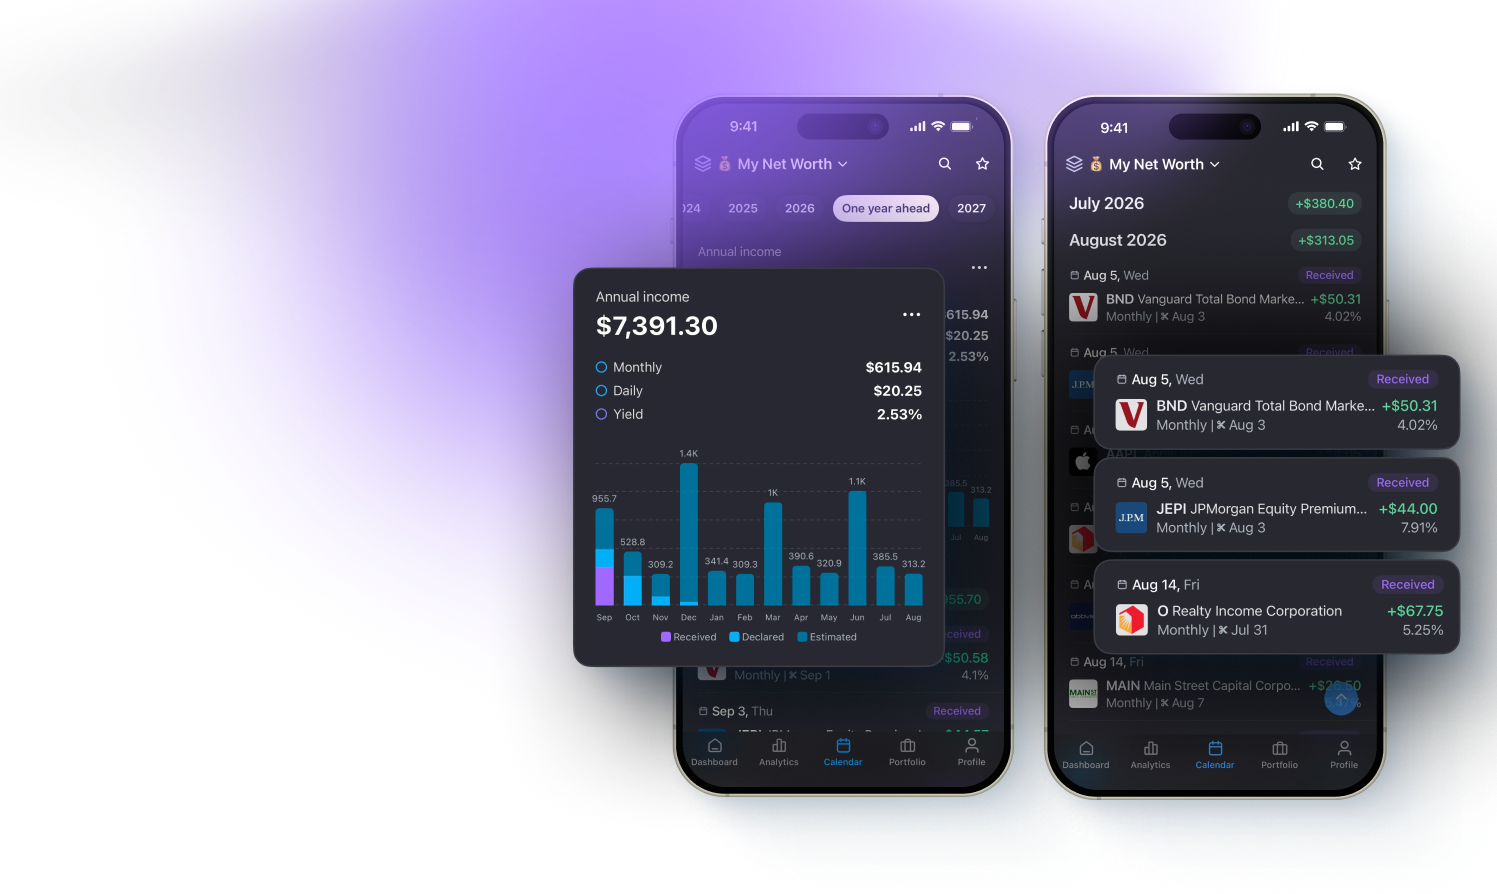
Take control of your investments with the Snowball Analytics mobile app. Everything you love about the web tracker, fully optimized for your smartphone.


S&P 500 Historical Performance: Reinvestment and Real Return
Many investment calculators assume a steady annual growth rate, such as 10%. The S&P 500's actual returns are uneven. A useful plan looks at the history of index performance, the effect of Dividend Reinvestment (DRIP) and the drag of CPI inflation.
The Core Drivers of S&P 500 Returns
- Historical Market Cycles: The index returned a CAGR of about 11% from 1970 through 2025 in this calculator's data, with dividends reinvested and before inflation, but this includes major bull markets and sharp downturns (such as the 1973-1974 bear market, the 2000 dotcom bust, and the 2008 financial crisis). Modeling with actual historical sequences shows how the timing of your investments affects the final balance.
- Dividend Reinvestment (DRIP): Companies in the index pay quarterly dividends. If you reinvest these dividends, they buy more index shares, compounding your growth. Dividends held as cash earn nothing, so without DRIP you miss a large part of the historical gain. In this data, dividends make up about a quarter of the average annual return (3.1 of 12.5 percentage points), and reinvested dividends account for about three quarters of the total gain over 1976–2025.
- CPI Inflation Erosion: In high-inflation eras (such as the late 1970s or 2022), nominal gains are offset by rising consumer prices. Adjusting your portfolio for actual historical CPI rates shows the true purchasing power of your money in today's dollars.
Strategic Inputs: Step-Up Contributions and Taxes
A useful plan allows for realistic behavior such as contributions that grow with your salary, and for the effect of taxes.
Advanced Strategies for Wealth Accumulation
- Savings Rate Step-Up (Indexation): If you keep your periodic savings contributions flat for 20 or 30 years, their real value declines due to inflation. Increasing your periodic contribution by 3% to 5% each year can reflect salary growth and helps your savings keep pace with inflation.
- The S&P 500 Tipping Point: Initially, your monthly contributions drive portfolio growth. Over time, as your share count increases, the S&P 500 gains and dividend payouts (in dollars) start to exceed your out-of-pocket savings additions. This tipping point is a milestone many investors track; it does not by itself mean financial independence.