Most income investors look for funds that deliver reliable monthly or quarterly payouts.
But occasionally a fund appears that doesn’t follow the usual rules… yet still manages to deliver impressive long-term performance.
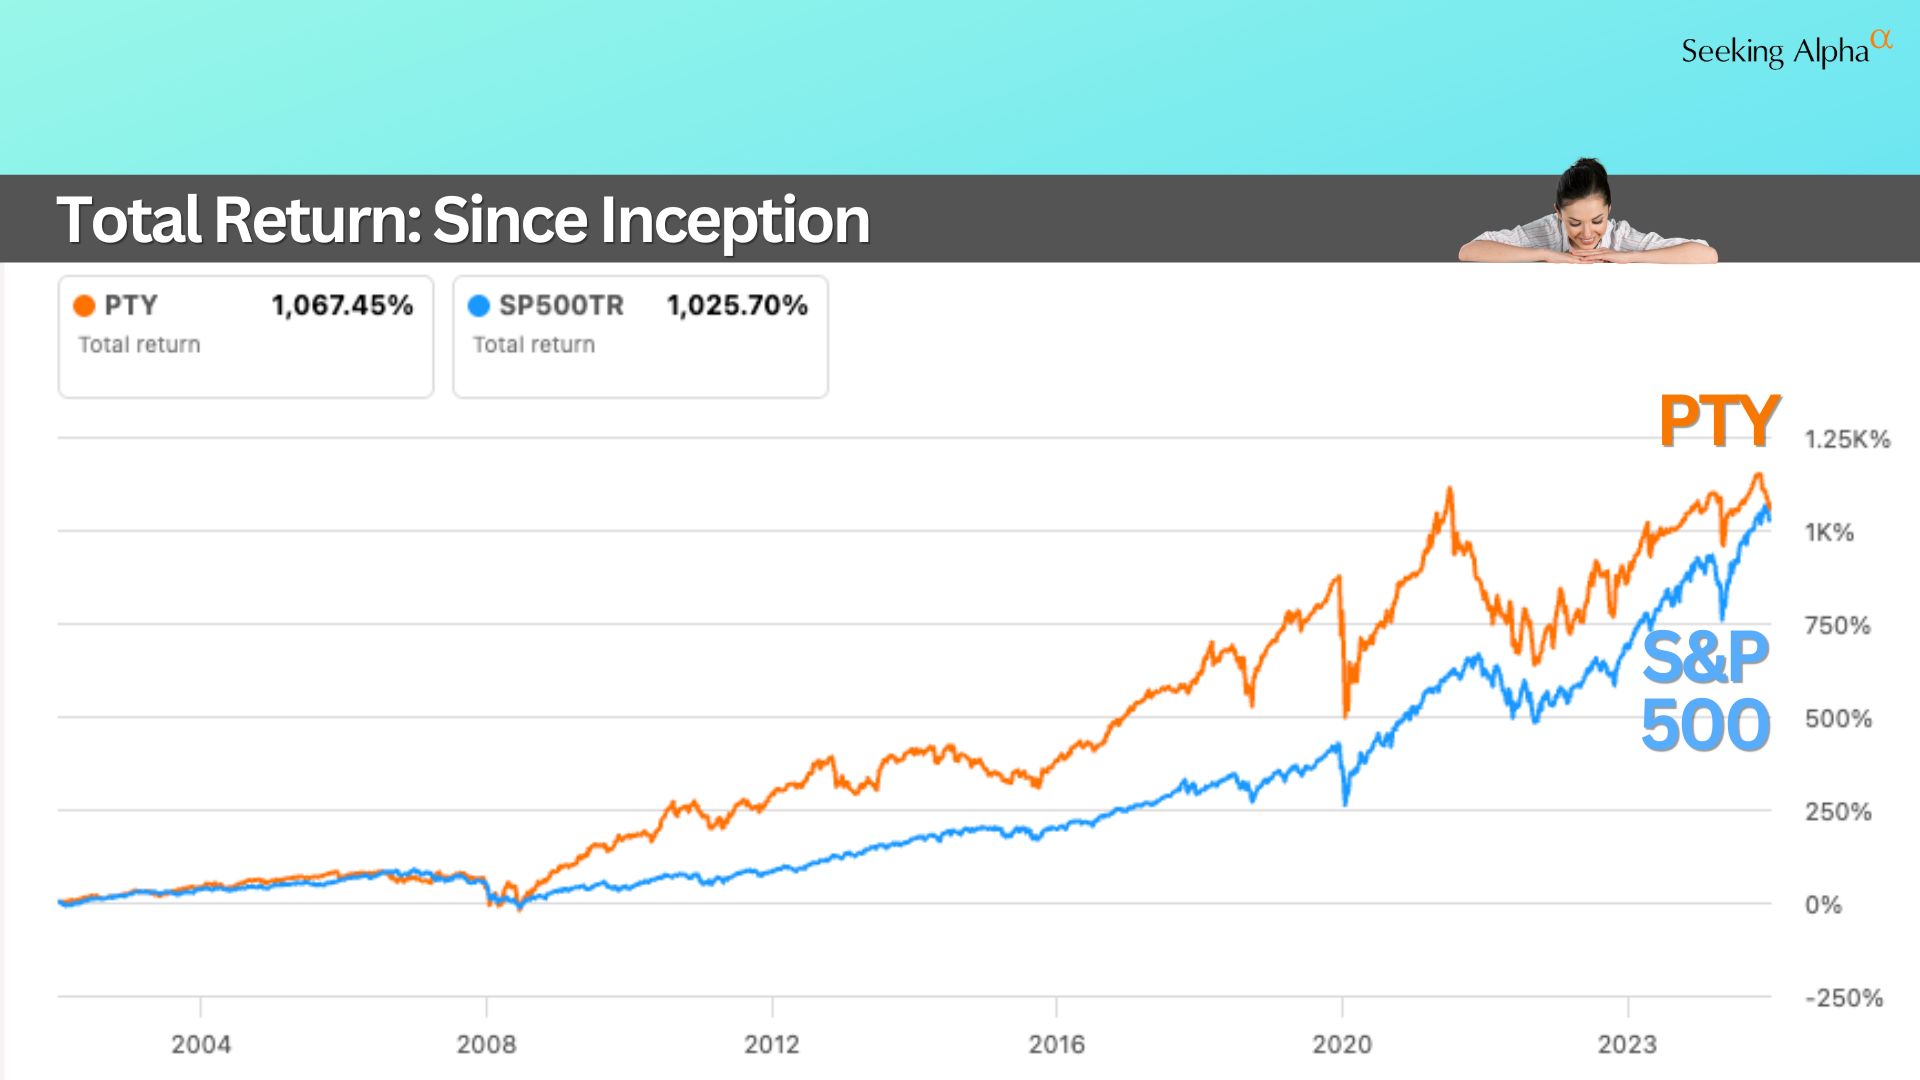
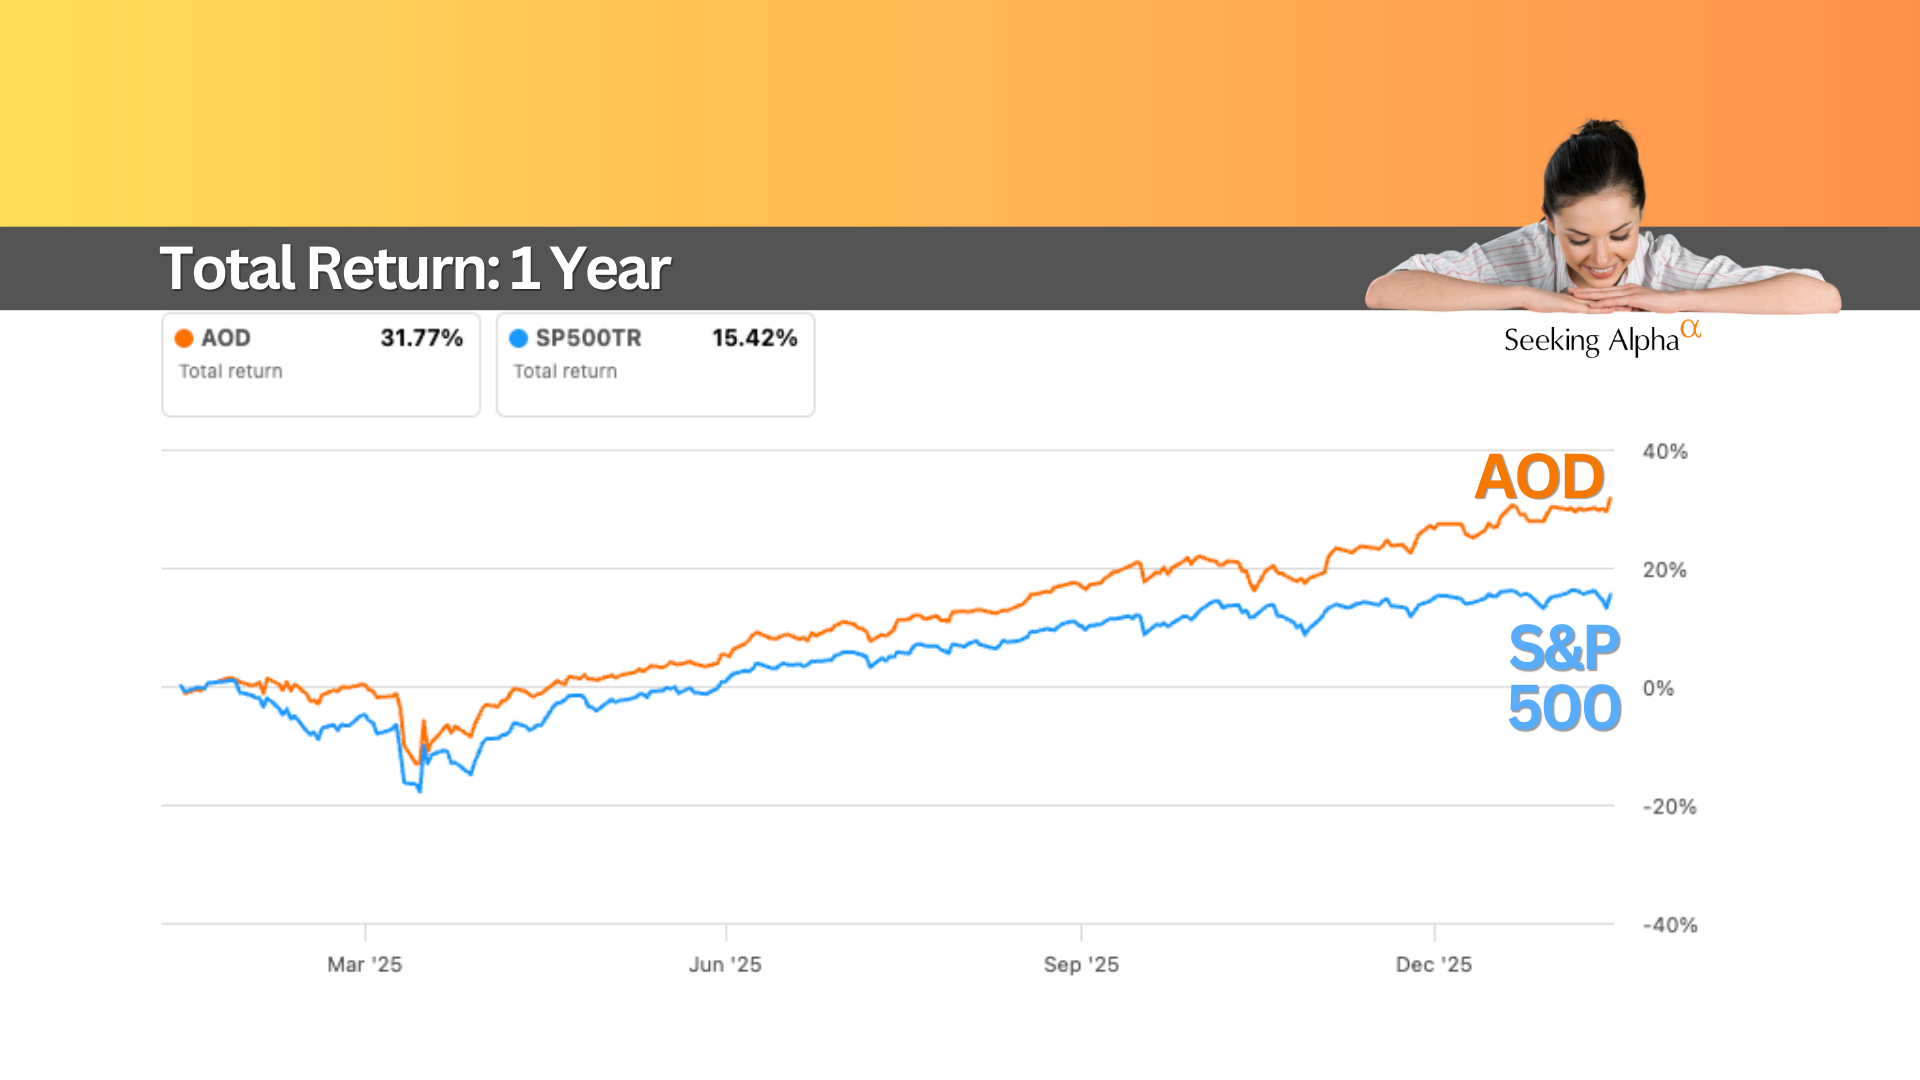
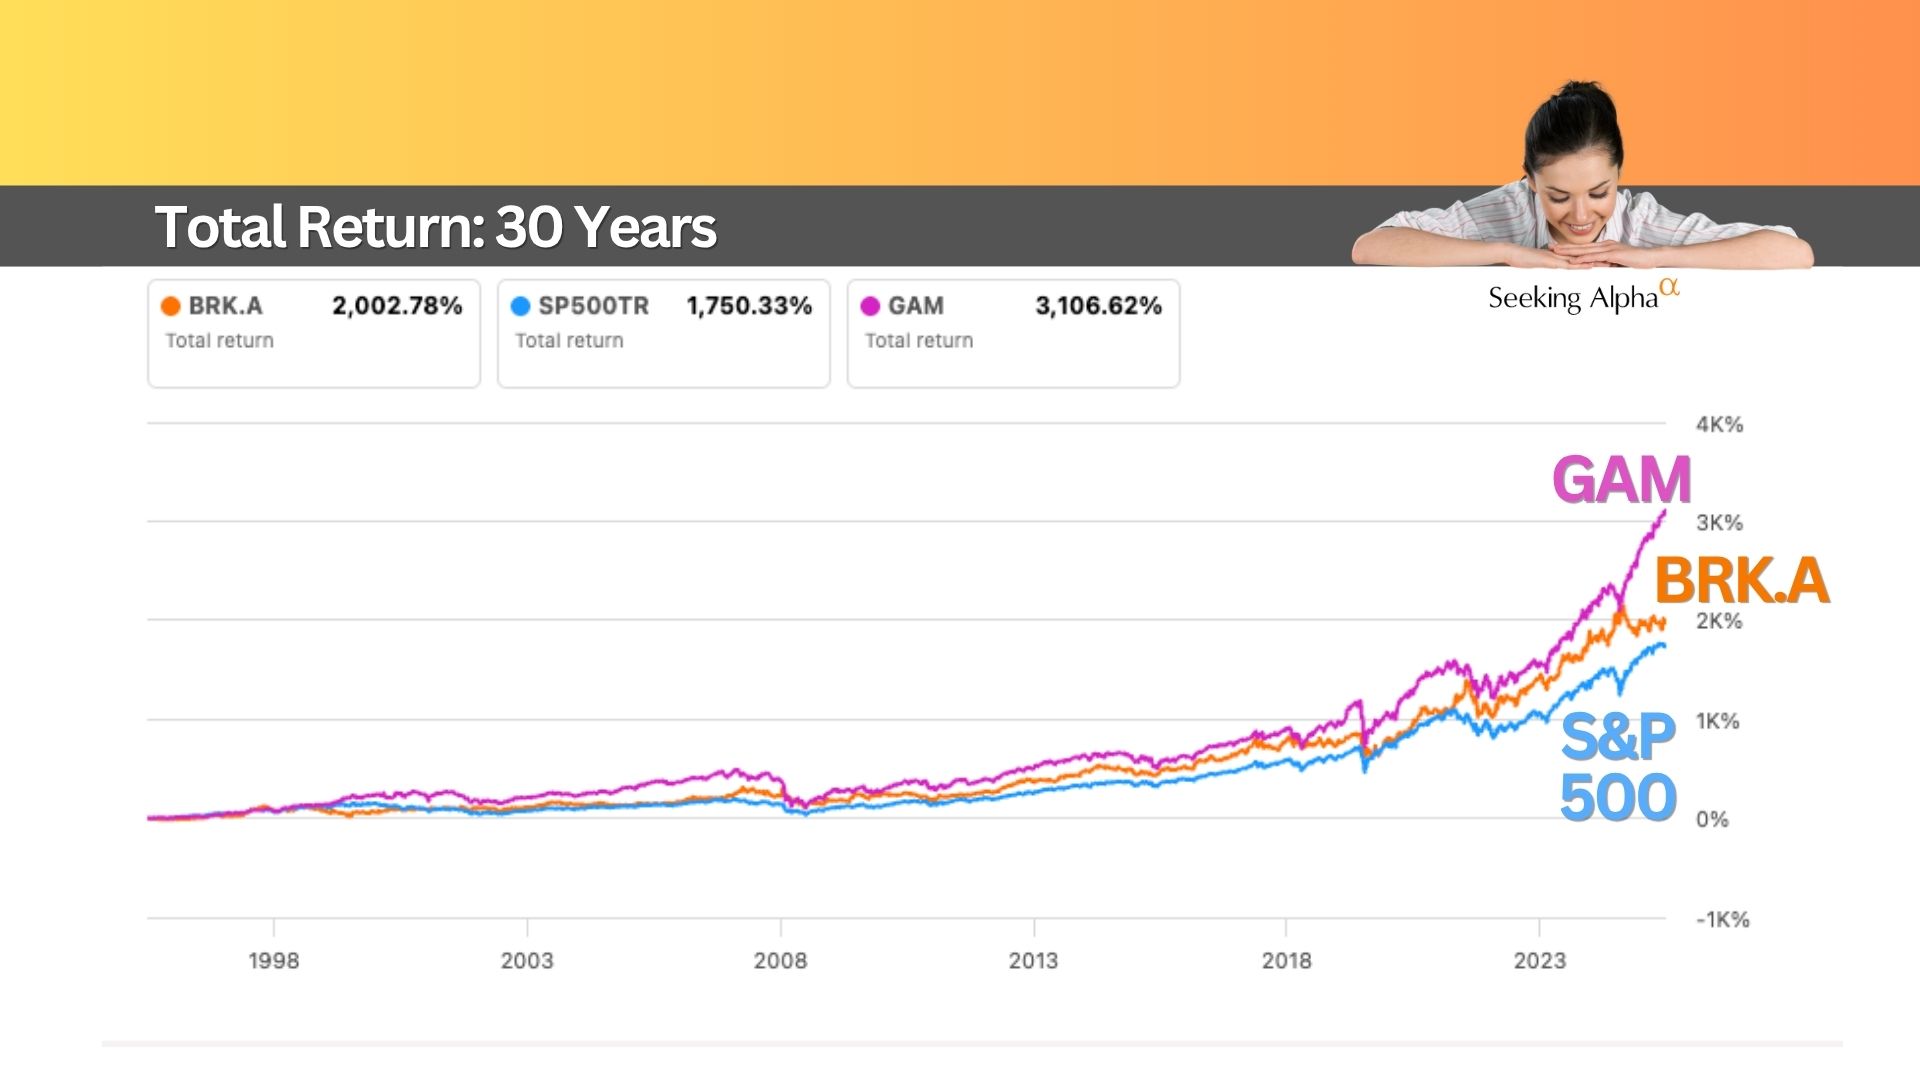
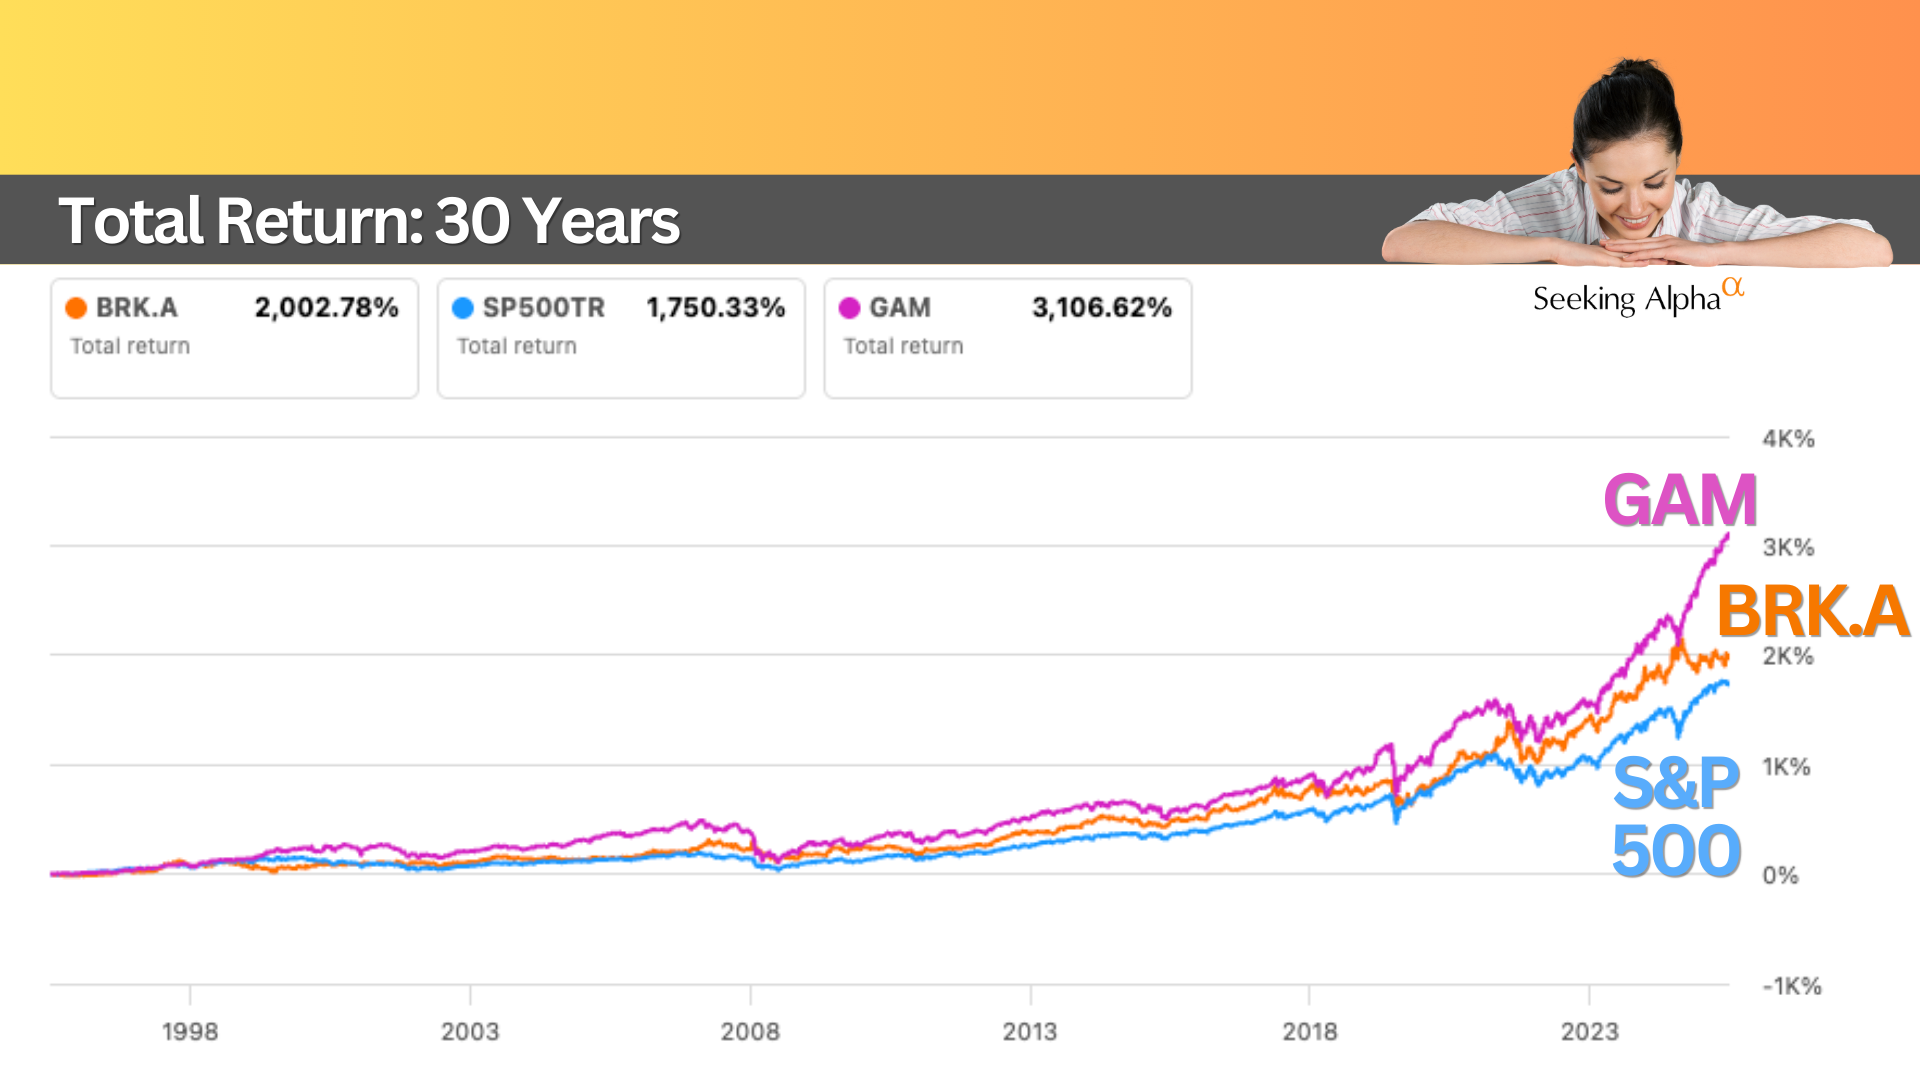
Today we’ll look at a fund with a yield of roughly 10%, and a track record that has quietly outperformed the S&P 500.
That fund is General American Investors Company Inc. (GAM).
One look at the long-term performance chart explains why investors keep rediscovering this fund.
Why GAM Kept Showing Up
There’s a theory that when you see something three times, you start paying attention.
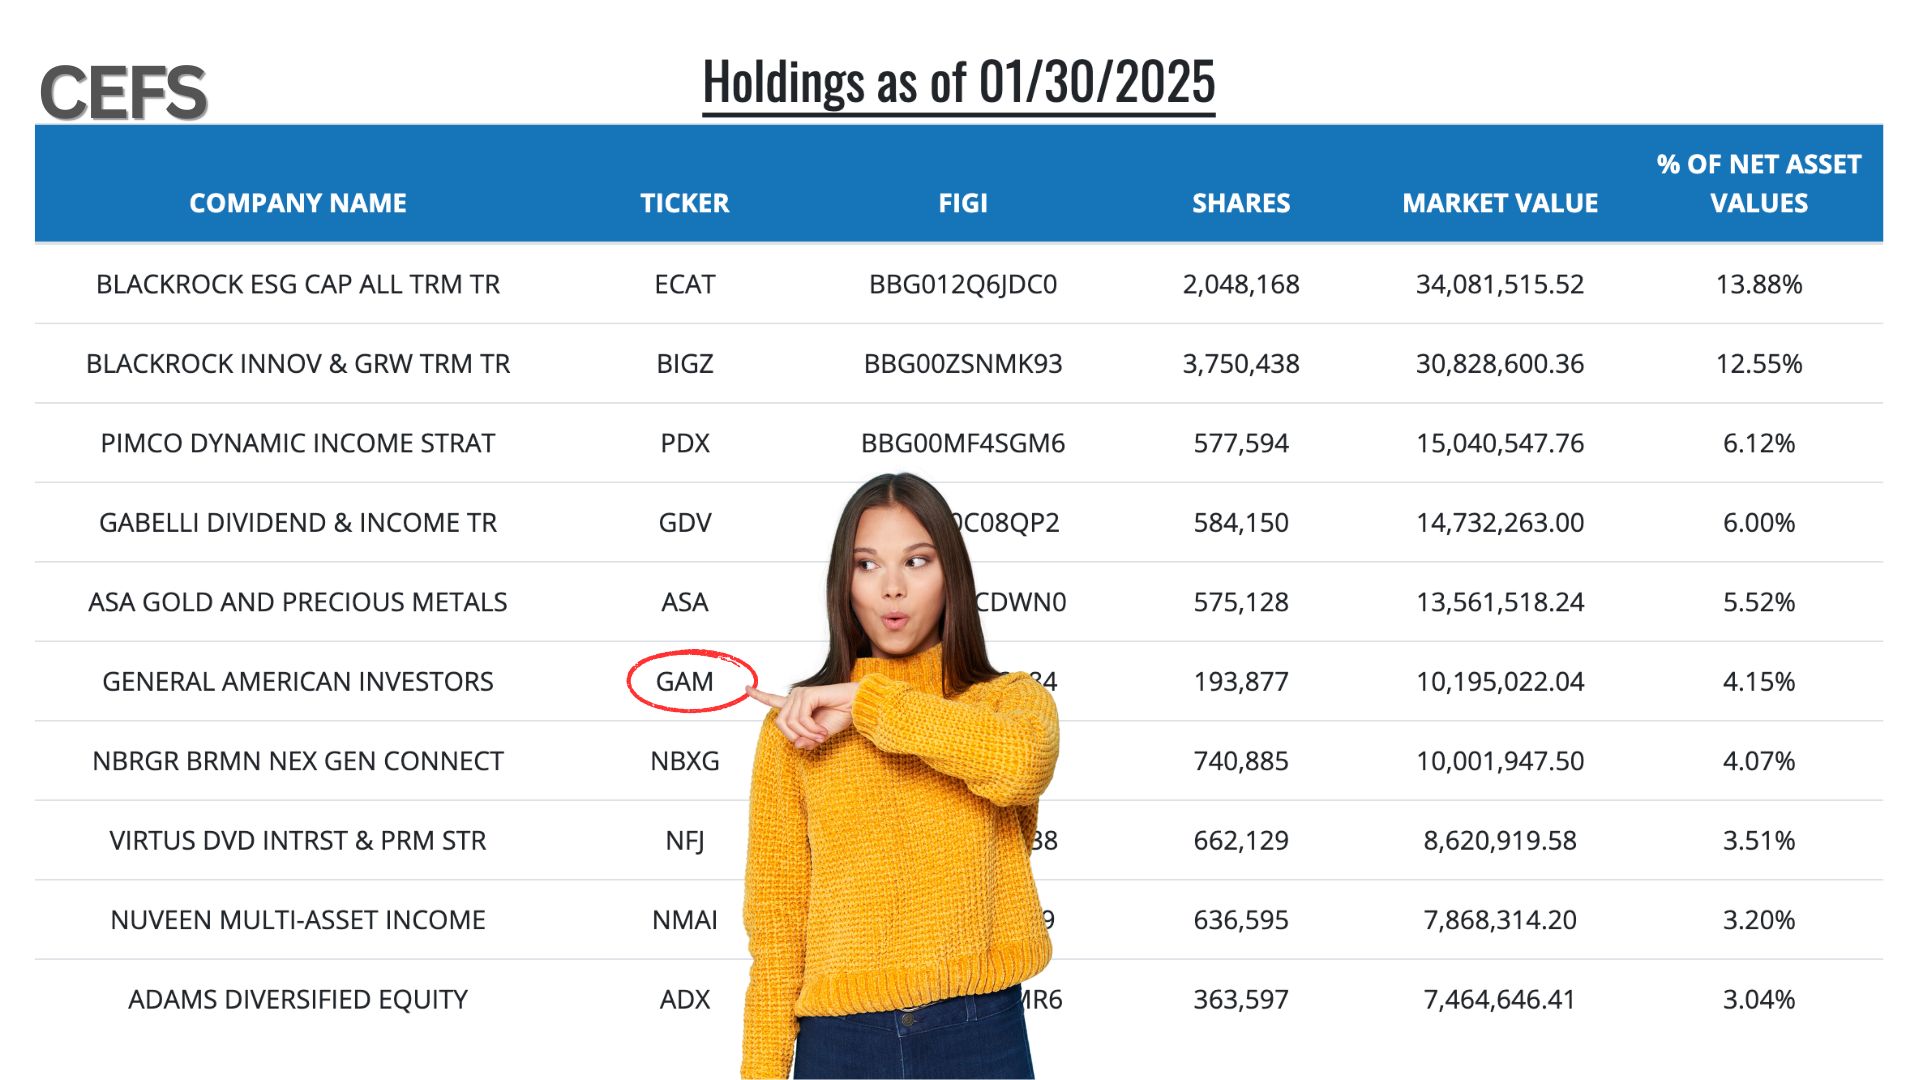
The first time I noticed GAM was while reviewing the CEFS fund in February 2025. GAM appeared as one of its top holdings.
Later in December 2025, an Armchair Insider Lounge member mentioned GAM as one of his long-time holdings.
Then again, in early 2026, when comparing CEFS with FOF, GAM appeared once more as a Top-10 holding.
After seeing it repeatedly in respected portfolios, I decided to take a closer look.
Distribution History
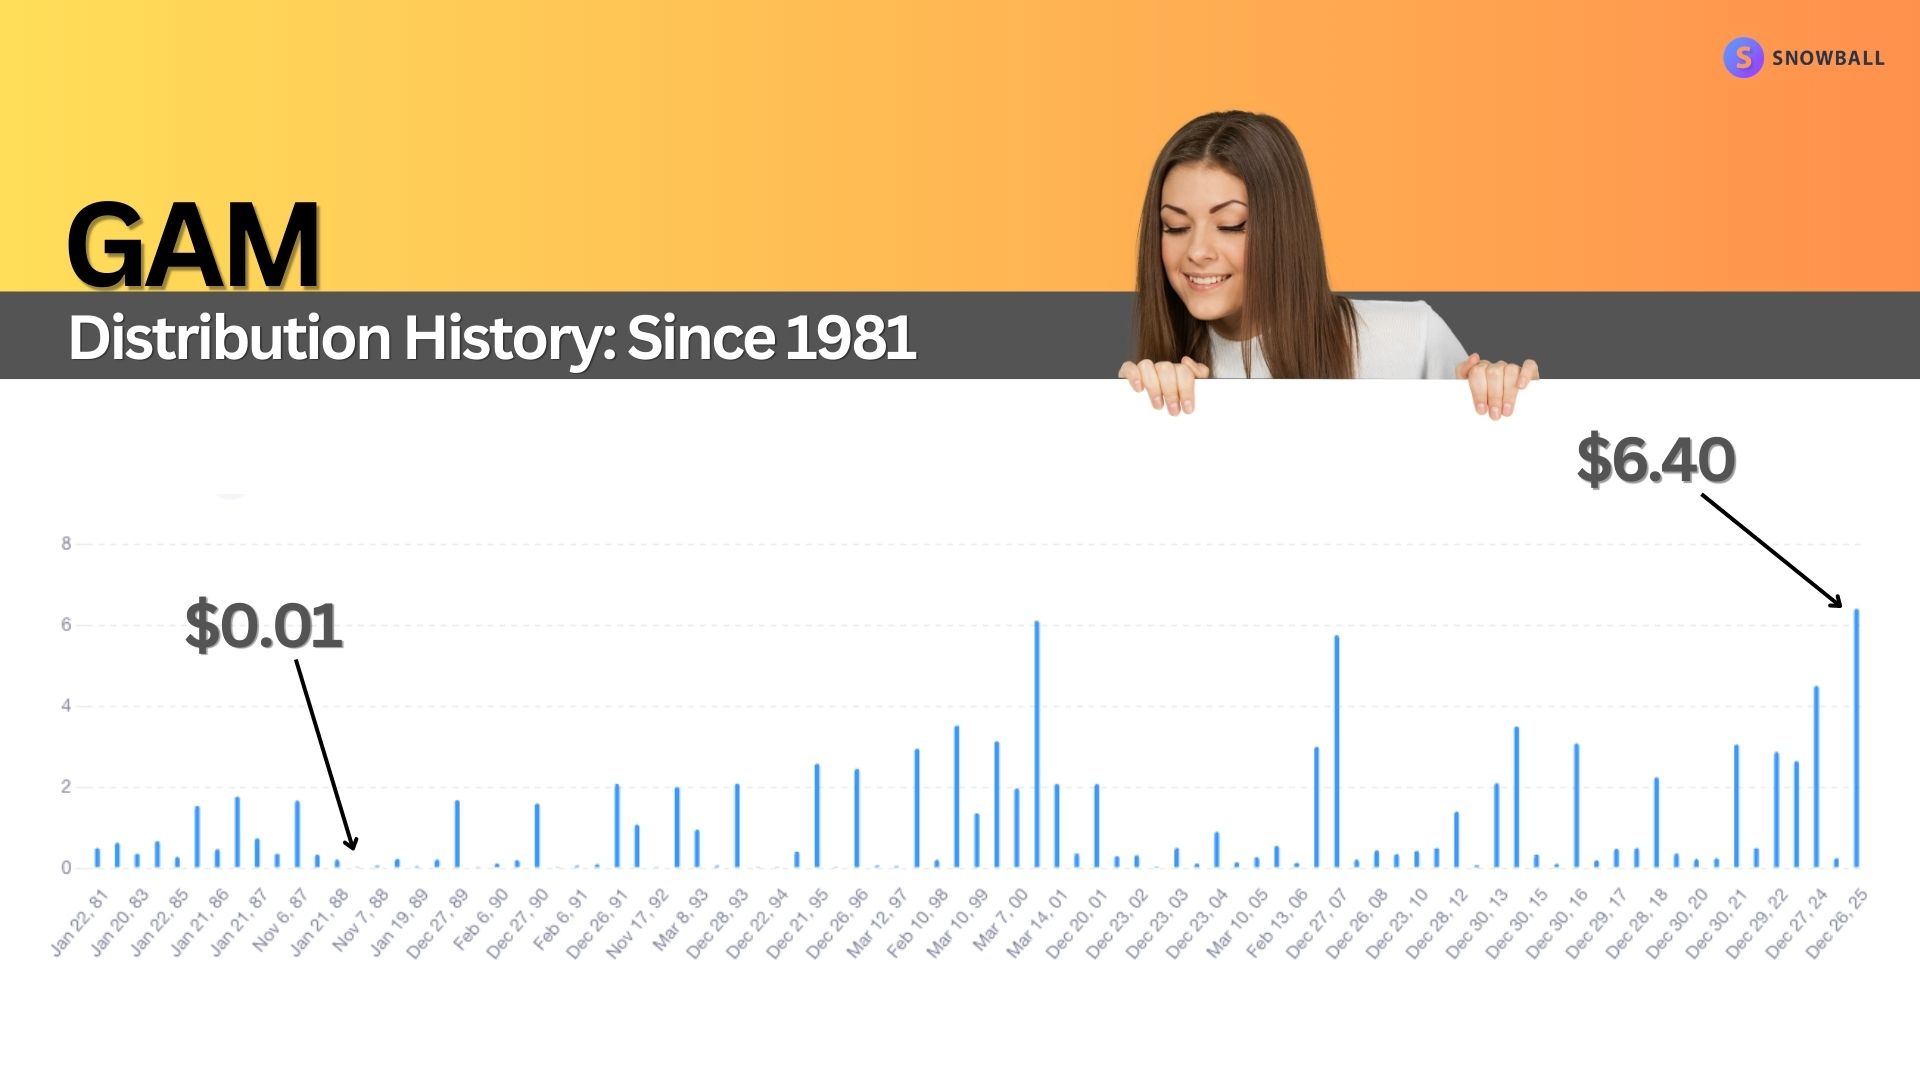
The distribution history is… unusual.
At first glance the payouts appear wildly inconsistent. Some years the distribution is only a few cents. Other years it exceeds $6 per share.
However, when you zoom into recent history, a pattern becomes clearer. Most of the distribution is typically paid once per year in December, sometimes with a smaller payment early in the following year.
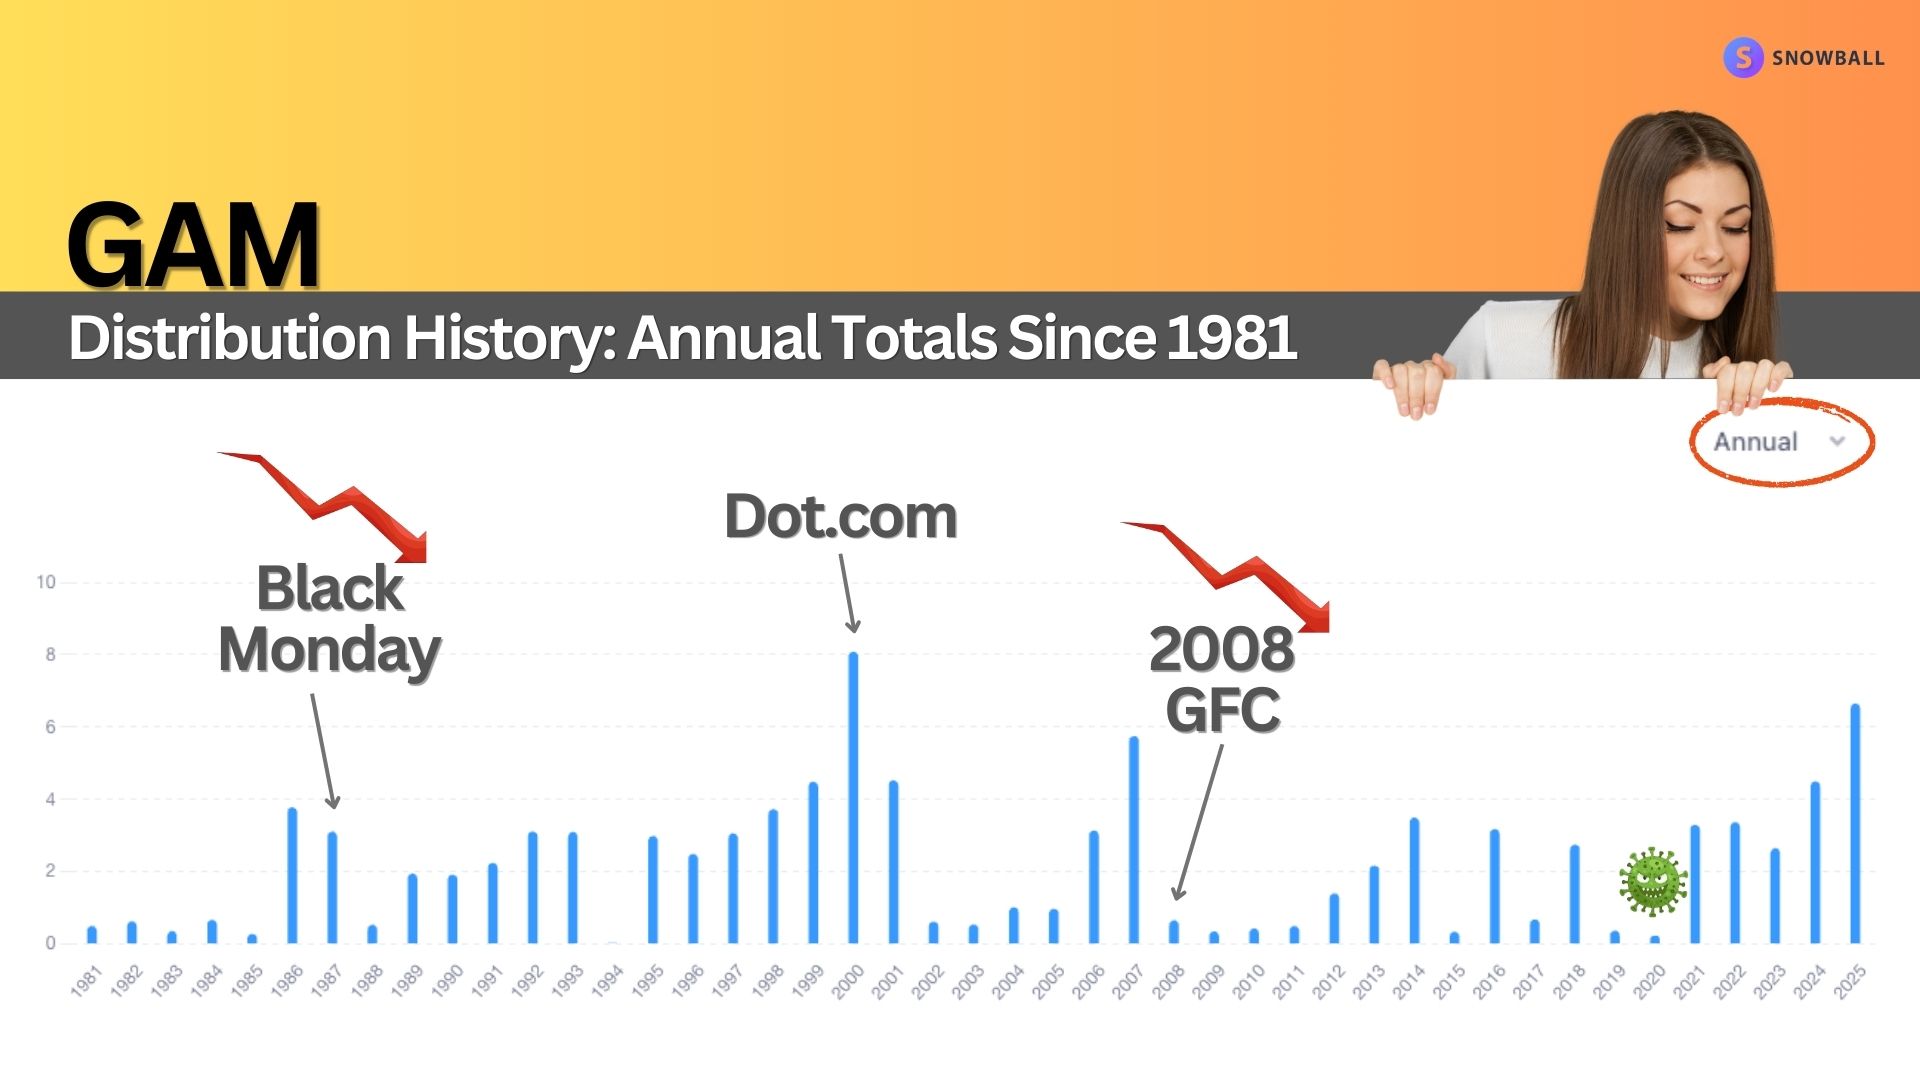
Looking at the annual totals helps explain what’s happening. Major market events show up clearly in the chart, including Black Monday in 1987, the Dot-com boom and bust, and the 2008 Global Financial Crisis.
During strong market periods the fund realizes capital gains and distributes them to shareholders. During weaker periods, distributions fall.
So there are two clear drawbacks for income investors:
Distributions are infrequent
Distributions are inconsistent
Even though the current yield is around 10%, the historical yield varies significantly from year to year.
That means GAM doesn’t behave like a paycheck.
Instead, it may function more like an annual bonus. One possible strategy is to reinvest those larger distributions into investments that provide more consistent monthly or quarterly income.
What Makes This Fund Different
General American Investors is an equity fund.
Unlike credit funds or bond funds, it invests primarily in stocks.
The portfolio typically holds 50 to 70 companies, with the top ten positions representing a large share of the fund.
Many of the holdings are familiar names including large U.S. companies and global businesses.
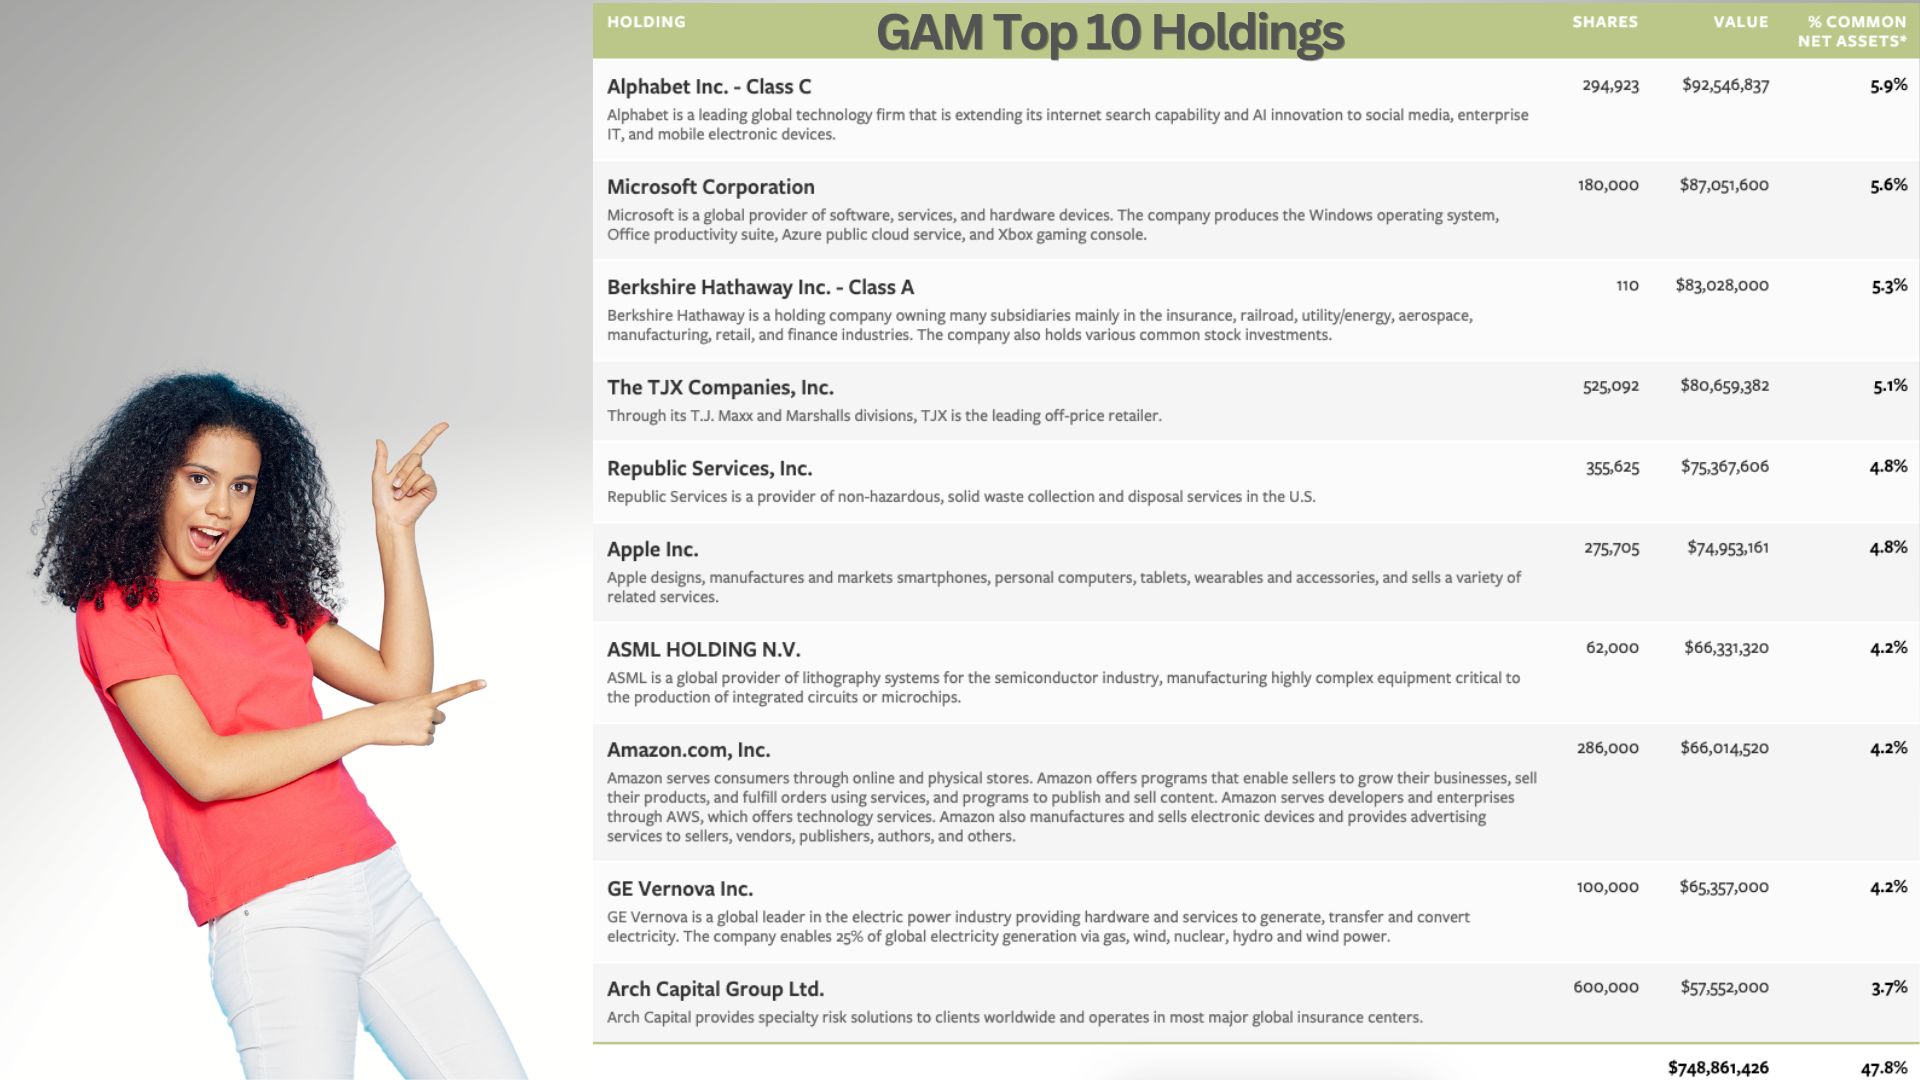
The key point is that GAM focuses on long-term capital appreciation, not just dividend income.
Most of the distributions come from realized capital gains rather than dividends.
Taxes and Fees
Because the fund distributes mostly realized gains, the tax treatment reflects that.
For the 2025 tax year, approximately 93% of the distribution was capital gains, with only a small portion classified as qualified dividend income.
The expense ratio is listed at 1.07%, which includes interest expenses related to leverage.
The fund uses moderate leverage of roughly 12%, financed through preferred shares with a fixed yield around 5.95%.
Pricing
Given the strong performance history, you might expect GAM to trade at a premium to its Net Asset Value.
Surprisingly, it doesn’t.
The fund currently trades at roughly an 11% discount to NAV.
There is also a long-running share buyback program allowing the fund to repurchase shares when the discount widens. Since the mid-1990s these buybacks have totaled more than $1 billion, helping support the share price.
My Take
GAM is not a typical income fund.
It won’t provide a predictable monthly paycheck.
But if your goal is long-term total return with occasional large distributions, it might be worth considering.
Sometimes the most interesting investments are the ones that don’t fit neatly into traditional categories.
To learn more, click here for the full Review.
Want to see how these funds fit into a real-world retirement strategy? I share my full portfolio and monthly updates for free, here: Armchair Insider. If you want to learn from other Income Investors (I do!), check out the Armchair Insider Lounge.