
Inflation is the silent wealth killer. While your savings account balance might look steady, the real value of that money shrinks year after year. For investors seeking income, this poses a critical challenge: how do you generate returns that not only provide cash flow today but also keep pace with—or ideally exceed—the rising cost of living?
The answer lies in dividend growth investing, a strategy that combines current income with the power of compounding increases. Unlike bonds with fixed payments or high-yield stocks with stagnant dividends, dividend growth stocks offer something unique: an income stream that rises over time, helping you stay ahead of inflation while building long-term wealth.
Whether you're a beginner learning the fundamentals or an experienced investor looking to optimize your strategy, this guide will walk you through building a dividend growth portfolio designed to beat inflation. And with tools like Snowball Analytics, tracking, analyzing, and optimizing your portfolio has never been easier.
Understanding Inflation: The Hidden Tax on Your Wealth
Before diving into portfolio construction, let's understand what we're up against. Inflation measures how much prices for goods and services increase over time. In the United States, inflation has averaged around 2.5% annually since 2000, with significant spikes in recent years. As of September 2025, the annual inflation rate stands at 3.0%.
Here's the sobering reality: since 2020, cumulative inflation has risen by approximately 25%. That means if you had $100,000 in cash five years ago, you'd need $125,000 today to maintain the same purchasing power.
Why Static Dividends Aren't Enough
Many investors gravitate toward high-yield dividend stocks, thinking a 5-6% yield will protect them from inflation. But here's the problem: if those dividends don't grow, inflation steadily erodes your real income.
Consider this comparison over 10 years with $100,000 invested:
Static 3% dividend: You receive $3,000 annually, every year. But due to 3% annual inflation, by year 10, that $3,000 has the purchasing power of only $2,232 in today's dollars—a 25.6% decline in real income.
Growing 3% starting dividend (7% annual growth): Your income starts at $3,000 but grows to $5,901 by year 10. After inflation adjustment, this represents $4,391 in real purchasing power—a 46.4% increase.
The difference is dramatic. While static income loses ground to inflation, dividend growth not only keeps pace but pulls ahead, creating a true hedge against rising prices.
Core Principles of Dividend Growth Portfolios
Building a portfolio that beats inflation requires understanding several fundamental principles. Let's break down what separates successful dividend growth investors from those who struggle.
Stock Selection: Quality Over Yield
The biggest mistake dividend investors make is chasing the highest yields. A 7-8% yield might look attractive, but it often signals trouble: either the company's stock price has crashed, or it's paying out more than it can afford.
Instead, focus on companies with these characteristics:
Strong dividend growth track record: Look for companies that have consistently raised dividends for at least 10 years, preferably 25+ years (Dividend Aristocrats). The S&P 500 Dividend Aristocrats have delivered average annual dividend growth of 6% over the past decade, significantly outpacing inflation.
Sustainable payout ratios: A healthy payout ratio—dividends as a percentage of earnings—typically falls between 40-60%. This leaves room for dividend increases and provides a cushion during economic downturns. Payout ratios above 70-80% raise red flags about dividend sustainability.
Financial strength: Companies that can grow dividends through recessions have solid balance sheets, strong cash flow, and competitive advantages (economic moats). They're not just paying dividends; they're investing in growth while rewarding shareholders.
Dividend growth rate: Target companies increasing dividends by 5-10% annually. Since 2020, top dividend growers have increased payouts by more than 40%, far exceeding the 25% inflation over the same period.
Diversification: Building a Resilient Portfolio
Concentration can amplify returns, but it also amplifies risk—especially when it comes to dividend income. If you're overweight in one sector and it faces headwinds, your entire income stream could be at risk.
A well-diversified dividend growth portfolio should include:
20-60 individual stocks across multiple sectors
Exposure to 5-7 different industries to avoid sector-specific risks
Mix of dividend yields and growth rates: Some higher-yielding, slower-growing stocks balanced with lower-yielding, faster-growing companies
Consider this sample allocation framework:
Sector | Conservative Portfolio (%) | Balanced Portfolio (%) | Growth-Focused Portfolio (%) |
Consumer Staples | 25 | 20 | 15 |
Healthcare | 20 | 15 | 15 |
Industrials | 15 | 15 | 20 |
Financials | 10 | 15 | 10 |
Utilities | 15 | 10 | 5 |
Technology | 5 | 12 | 20 |
REITs | 5 | 8 | 10 |
Communication | 5 | 5 | 5 |
Conservative portfolios emphasize stability with higher allocations to defensive sectors like utilities and consumer staples. Balanced portfolios spread risk more evenly. Growth-focused portfolios tilt toward sectors with higher dividend growth potential, accepting slightly more volatility.
Key Dividend Metrics to Track
Understanding dividend metrics is crucial for making informed decisions. Here are the most important ones:
Dividend Yield: Annual dividends per share divided by current stock price. The S&P 500 currently yields around 1.5%, while dividend aristocrats average 2-3%.
Dividend Growth Rate: How fast the dividend increases annually. The S&P 500 has grown dividends by 6.4-6.9% annually in recent years, while top dividend growers often exceed 9%.
Payout Ratio: Dividends divided by earnings. Safe ratios typically range from 40-70%, depending on the industry.
Yield on Cost (YOC): Your annual dividend divided by your original purchase price. This reveals the true return on your initial investment as dividends grow over time.
Here's a powerful example: If you bought a stock at $50 with a $1.50 dividend (3% yield), and the company grows its dividend by 7% annually, your yield on cost looks like this:
Year | Dividend/Share | Yield on Cost | Annual Income (200 shares) |
0 | $1.50 | 3.0% | $300 |
5 | $2.10 | 4.2% | $421 |
10 | $2.95 | 5.9% | $590 |
15 | $4.14 | 8.3% | $828 |
20 | $5.80 | 11.6% | $1,161 |
This is why long-term dividend growth investors often see double-digit yields on cost after holding quality companies for years.
The Power of Dividend Reinvestment
One of the most powerful wealth-building tools is dividend reinvestment (DRIP). Historical data shows that approximately 40% of the S&P 500's total return since 1930 came from reinvested dividends, and some studies suggest it's even higher—up to 84% when accounting for compounding.
Consider this example: Starting with 100 shares at $50 each, with 6% annual price appreciation and 6% dividend growth:
Year | Shares (No DRIP) | Shares (With DRIP) | Value With DRIP | Difference |
0 | 100 | 100 | $5,000 | $0 |
10 | 100 | 148 | $13,254 | $4,300 |
20 | 100 | 219 | $35,136 | $19,100 |
25 | 100 | 267 | $57,207 | $35,748 |
Over 25 years, reinvesting dividends more than doubles your portfolio value compared to taking cash. This is the compounding snowball effect in action.
Snowball Analytics makes dividend tracking and reinvestment planning effortless with its comprehensive dividend calendar, showing projected income and payment dates for all your holdings.
Designing a Portfolio That Outpaces Inflation
Now that you understand the principles, let's put them into practice with a step-by-step framework.
Step 1: Identify Quality Dividend Growers
Start by screening for companies with:
Minimum 10-year dividend growth streak (25+ years for extra safety)
Payout ratio below 70%
5-year average dividend growth of at least 5%
Strong fundamentals: positive free cash flow, reasonable debt levels, stable or growing revenue
Good starting points include:
Dividend Aristocrats: 69 S&P 500 companies with 25+ years of consecutive dividend increases
Dividend Kings: 55 companies with 50+ years of dividend growth
Sector leaders: Companies like McDonald's (49 years of increases, 41.6% dividend growth since 2020), Johnson & Johnson (63 years of growth), and ADP (50 years of growth)
Step 2: Balance Yield vs. Growth
There's a natural trade-off between current yield and dividend growth rate. Higher-yielding stocks often grow dividends more slowly, while lower-yielding stocks may offer faster growth.
Compare these typical profiles:
Stock Type | Dividend Yield | 5-Yr Dividend Growth | Payout Ratio | Risk Level |
High Yield | 6.5% | 2.0% | 85% | High |
Dividend Aristocrat | 3.2% | 6.0% | 60% | Low |
Dividend Growth | 2.5% | 9.0% | 45% | Medium |
S&P 500 Average | 1.5% | 6.4% | 55% | Medium |
For beating inflation, dividend growth stocks with 2-3% starting yields and 7-10% annual growth often outperform high-yield stocks with minimal growth. Research shows that dividend growth factors have consistently outperformed high-yield factors since 2010.
Step 3: Project Income vs. Inflation
Once you've selected your holdings, project how your income will grow relative to inflation. Here's a realistic scenario:
Portfolio: $100,000 invested
Average starting yield: 3%
Average dividend growth: 7% annually
Assumed inflation: 3% annually
Year | Nominal Income | Real Income (Inflation-Adjusted) | Real Purchasing Power Change |
0 | $3,000 | $3,000 | Baseline |
5 | $4,208 | $3,630 | +21.0% |
10 | $5,901 | $4,391 | +46.4% |
15 | $8,276 | $5,289 | +76.3% |
20 | $11,609 | $6,496 | +116.5% |
After 20 years, your dividend income has more than doubled in real purchasing power, while a static 3% dividend would have lost over 25% of its real value.
This is the core advantage of dividend growth investing: your income not only keeps pace with inflation but accelerates past it over time.
Step 4: Utilize Snowball Analytics for Portfolio Construction
Building and tracking a dividend growth portfolio manually can be overwhelming. Snowball Analytics streamlines the entire process:
Automatic brokerage connections: Link 1,000+ brokers worldwide and automatically import your holdings
Dividend analytics dashboard: View projected annual income, dividend growth rates, payout ratios, and dividend safety ratings all in one place
Dividend calendar: See exactly when dividends are paid and forecast future income based on your current holdings
Portfolio rebalancing tools: Get one-click recommendations to maintain your target allocations
Benchmarking: Compare your portfolio's performance against the S&P 500, dividend aristocrats indices, and hundreds of other benchmarks
These features give you institutional-grade analytics without the complexity, making it easy to build and optimize a dividend growth portfolio designed to beat inflation.
Monitoring and Adjusting the Portfolio
Building the portfolio is just the beginning. To ensure it continues beating inflation, you need ongoing monitoring and periodic adjustments.
Track Dividend Growth and Safety
Monitor these key indicators quarterly:
Dividend growth trends: Are your holdings still increasing dividends at their historical rates? According to recent data, 71% of dividend growth portfolio holdings declared increases averaging 10% in 2025. If your holdings are lagging significantly, investigate why.
Payout ratio changes: Rising payout ratios can signal trouble. If a company's payout ratio climbs from 50% to 80%, its dividend may be at risk.
Earnings and cash flow: Dividend safety depends on underlying business performance. Use Snowball Analytics' company fundamentals feature to track revenue growth, profit margins, and free cash flow.
Dividend safety ratings: Snowball Analytics provides proprietary dividend ratings based on 13 fundamental parameters, helping you identify which holdings might cut dividends before it happens.
Set Up Alerts and Review Triggers
Don't wait for annual reviews to catch problems. Set alerts for:
Dividend cuts or suspensions
Payout ratio exceeding 75%
Negative earnings surprises
Significant debt increases
Snowball Analytics can help automate this monitoring, ensuring you stay informed about portfolio health.
Rebalancing Strategy and Frequency
How often should you rebalance? Research shows that annual rebalancing is optimal for most dividend investors. It's frequent enough to maintain your target allocations without generating excessive transaction costs or taxes.
Quarterly rebalancing typically doesn't improve returns enough to justify the added costs. Waiting longer than a year allows your portfolio to drift too far from your risk targets.
Best practices for rebalancing:
Use new contributions first: When adding money, direct it to underweighted positions rather than selling and triggering taxes
Harvest tax losses: If rebalancing in taxable accounts, look for opportunities to offset gains with losses
Consider threshold-based triggers: Some investors rebalance when allocations drift 5-10% from targets, rather than on a fixed schedule
Focus on categories, not individual stocks: Rebalance at the sector/category level to maintain diversification without micromanaging every position
Snowball Analytics' rebalancing tool considers multiple factors including tax implications and transaction costs, providing smart recommendations that optimize your portfolio efficiently.
When to Sell
Not every stock deserves a permanent spot in your portfolio. Consider selling when:
Dividend is cut or suspended: Unless there's a clear path to restoration, a cut signals fundamental problems
Payout ratio exceeds 90% persistently: The dividend is likely unsustainable
Dividend growth stalls: If a company stops growing its dividend or growth slows to 1-2% annually, it's no longer serving your inflation-beating goal
Better opportunities emerge: If you find significantly higher-quality dividend growers, it may make sense to rotate capital
Fundamental deterioration: Declining revenue, shrinking margins, or rising debt levels all threaten future dividend capacity
Common Pitfalls to Avoid
Even experienced investors make mistakes with dividend growth strategies. Avoid these common traps:
The Yield Trap
High yields are seductive, but they're often red flags. A 7-8% yield might indicate:
The stock price has crashed due to fundamental problems
The payout ratio is unsustainably high
The dividend is about to be cut
Example: Walgreens was a dividend aristocrat until 2024, when it cut its dividend nearly in half. Investors chasing its elevated yield before the cut suffered both income loss and capital depreciation.
Solution: Focus on dividend growth rate, not just current yield. A 2.5% yield growing at 9% annually will surpass a static 5% yield in just 8 years.
Neglecting Dividend Reinvestment
Studies show that investors who directly own stocks reinvest less than 10% of dividends. This is a massive missed opportunity. From 1928 to 2021, $1,000 invested with dividends reinvested grew to over $7 million, compared to just $258,000 without reinvestment.
Solution: Set up automatic dividend reinvestment through your broker or Snowball Analytics. Make it effortless so you're not tempted to spend the income before your goals are met.
Overconcentration in High-Yield Sectors
Utilities, REITs, and financials often offer the highest yields, tempting investors to overweight these sectors. But this creates significant risk:
Interest rate sensitivity (especially utilities and REITs)
Sector-specific downturns hitting your entire income stream
Missing growth from other sectors like technology and healthcare
Solution: Maintain sector diversification as outlined earlier. No sector should exceed 25% of your portfolio.
Ignoring Valuation
Just because a stock is a dividend grower doesn't mean you should buy it at any price. Overpaying reduces your starting yield and future returns.
Solution: Use Snowball Analytics' valuation metrics to ensure you're buying at reasonable prices. Compare P/E ratios to historical averages and consider dollar-cost averaging to smooth out entry points.
Focusing on Yield on Cost Instead of Total Return
Some investors become emotionally attached to holdings with high yield on cost, refusing to sell even when better opportunities exist. Remember: your broker doesn't care about your cost basis, and neither does the market.
Solution: Evaluate holdings based on forward-looking prospects, not past purchase prices. If a stock no longer fits your strategy, redeploy capital to better opportunities.
Case Study: Building an Inflation-Beating Portfolio
Let's walk through a practical example to see how this strategy works in practice.
Investor Profile: Sarah, 45 years old, seeking inflation-protected income for eventual retirement
Starting Capital: $100,000
Investment Horizon: 20+ years
Goal: Build dividend income that outpaces inflation by at least 2% annually
Portfolio Construction
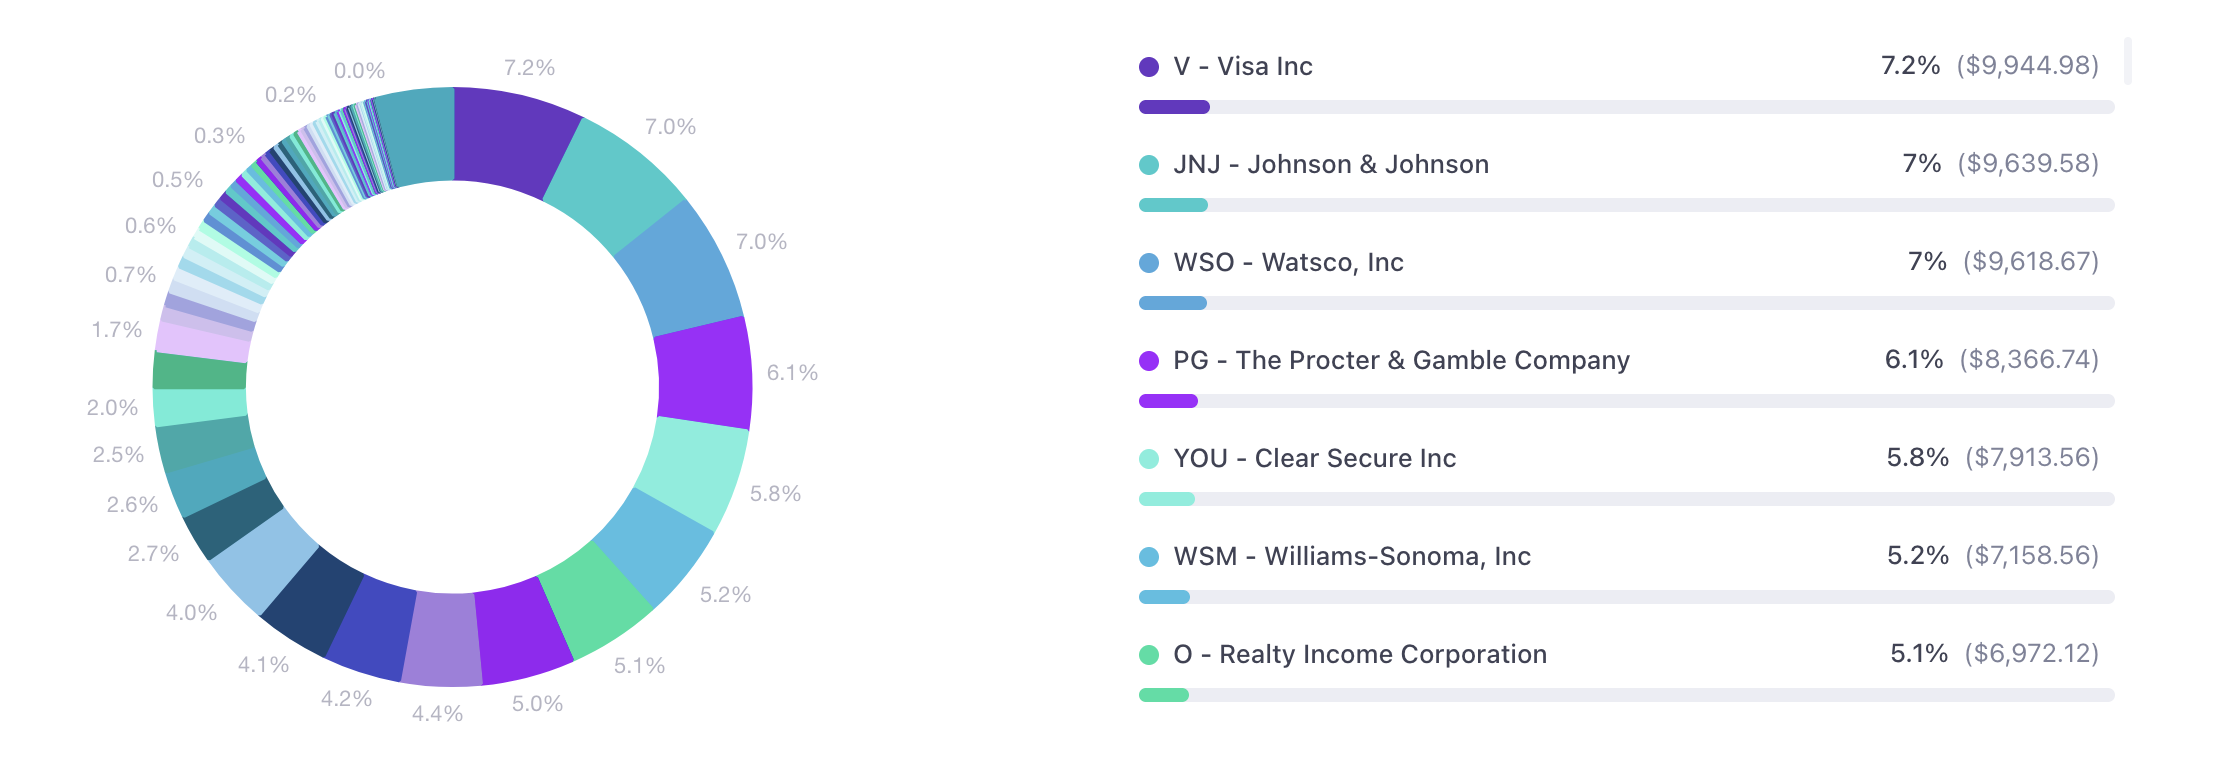
Sarah builds a diversified portfolio of 30 dividend growth stocks using Snowball Analytics' screening tools:
Core Holdings (60% of portfolio):
Consumer Staples: Johnson & Johnson, Procter & Gamble, Coca-Cola
Healthcare: Medtronic, Abbott Laboratories
Industrials: ADP, 3M, Honeywell
Financials: Visa, Mastercard
Growth Holdings (30% of portfolio):
Technology: Microsoft, Broadcom
Consumer Discretionary: McDonald's, Starbucks
Industrials: Waste Management
Income Holdings (10% of portfolio):
REITs: Realty Income
Utilities: NextEra Energy
Portfolio Characteristics:
Average starting yield: 2.8%
Average 5-year dividend growth: 7.5%
Average payout ratio: 53%
Portfolio beta: 0.85 (lower volatility than market)
Projected Results
Assuming 3% average annual inflation:
Year 1:
Starting income: $2,800
Real income (inflation-adjusted): $2,800
Year 5:
Projected income: $3,920
Real income: $3,380 (+20.7% purchasing power)
Year 10:
Projected income: $5,774
Real income: $4,296 (+53.4% purchasing power)
Year 15:
Projected income: $8,506
Real income: $5,438 (+94.2% purchasing power)
Year 20:
Projected income: $12,530
Real income: $7,013 (+150.5% purchasing power)
By year 20, Sarah's dividend income has grown 347% nominally and 150% in real purchasing power—far exceeding her goal of beating inflation by 2% annually. With reinvestment, her portfolio value has grown even more dramatically.
Sarah uses Snowball Analytics to:
Track actual dividend growth vs. projections
Monitor for any dividend safety concerns
Rebalance annually to maintain target allocations
Visualize her progress toward her income goals
This disciplined approach, powered by quality dividend growers and supported by comprehensive analytics, delivers exactly what she needs: growing income that consistently beats inflation.
Key Takeaways and Action Steps
Building a dividend growth portfolio that beats inflation isn't complicated, but it does require discipline and the right tools. Here's what you need to remember:
Focus on dividend growth, not just high yields. Companies increasing dividends by 6-10% annually will outpace inflation (currently 3%) and compound your wealth over time.
Maintain sustainable payout ratios. Target companies with payout ratios of 40-60%, ensuring dividends have room to grow and withstand economic challenges.
Diversify across sectors and holdings. Spread your portfolio across 20-60 stocks in 5-7 different sectors to reduce concentration risk.
Reinvest dividends consistently. This unlocks the full power of compounding, potentially doubling or tripling your long-term returns.
Monitor and rebalance annually. Track dividend safety, payout ratios, and portfolio drift, adjusting once per year to maintain your strategy.
Use professional-grade tools. Snowball Analytics provides the dividend tracking, analytics, and rebalancing capabilities you need to build and optimize an inflation-beating portfolio.
Your Next Steps
Ready to build your dividend growth portfolio? Here's how to get started:
Step 1: Open a Snowball Analytics account and connect your brokerage. The platform supports 1,000+ brokers worldwide and offers a free trial to explore all features.
Step 2: Screen for quality dividend growth stocks using the criteria outlined in this guide: 10+ year growth streaks, payout ratios under 70%, and 5%+ annual dividend growth.
Step 3: Build your initial portfolio with proper diversification across sectors. Start with 20-30 holdings if you're comfortable, or fewer if you're just beginning.
Step 4: Set up automatic dividend reinvestment and use Snowball Analytics' dividend calendar to track projected income.
Step 5: Review quarterly, rebalance annually, and watch your inflation-adjusted income grow year after year.
The sooner you start, the more time compounding has to work its magic. A dividend growth portfolio isn't a get-rich-quick scheme—it's a proven, data-backed strategy for building lasting wealth and income that keeps pace with (and beats) inflation over decades.
Inflation will continue eroding purchasing power. The question is: will your income grow with it, or fall behind? With dividend growth investing and the right tools, you have everything you need to stay ahead.
Start building your inflation-beating portfolio today with Snowball Analytics.