
High-yield ETFs have become increasingly popular among income investors seeking consistent cash flow, but they also attract criticism and confusion. Many investors assume that falling prices, large distributions, or reverse splits are red flags. In reality, most of these concerns stem from misunderstandings about how these funds operate.
Let’s clarify three of the most common myths around Net Asset Value (NAV), Return of Capital (ROC), and reverse splits, using clear examples and simple logic.
1. The Myth of NAV Erosion
The misconception:
When investors see a fund’s price drop right after a dividend payout, they often assume the ETF is “eating itself” or destroying its NAV.
The truth:
When a fund pays a dividend, the NAV naturally declines because cash leaves the fund and enters the investor’s account. This isn’t a loss, it’s simply the transfer of value from the fund’s holdings to the investor.
Think of it as moving money from your left pocket to your right one, your total wealth hasn’t changed.
What actually causes real NAV erosion?
High management fees: Gradually drain performance.
Decline in the underlying assets: If the fund’s holdings lose value, NAV drops too.
An ineffective income strategy: If a fund’s income strategy consistently loses more than it earns, that’s true capital erosion.
The key metric:
Look at total return, the combination of price movement and dividends (after taxes and fees). Price alone doesn’t tell the whole story. A fund can show a falling price chart yet deliver strong income once dividends are included.
Personally, I like using Snowball Analytics for this because it shows my true total return, factoring in both taxes and fees. It gives a clear, realistic picture of how my investments actually perform.
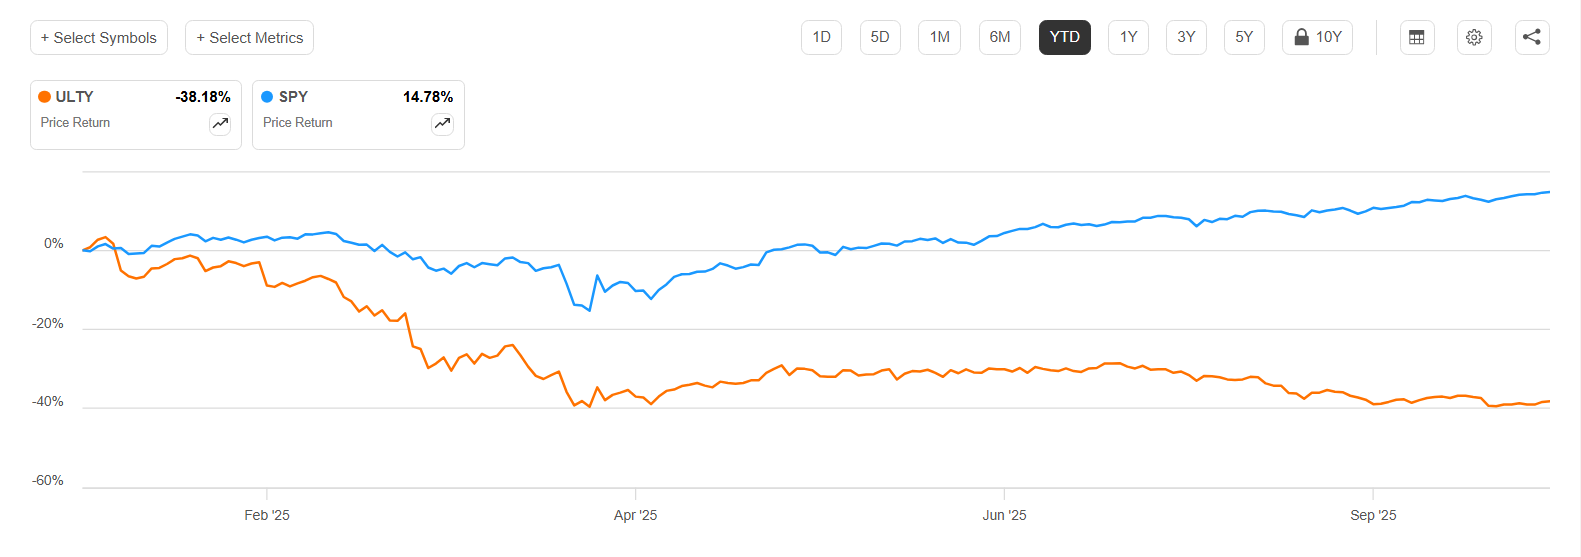
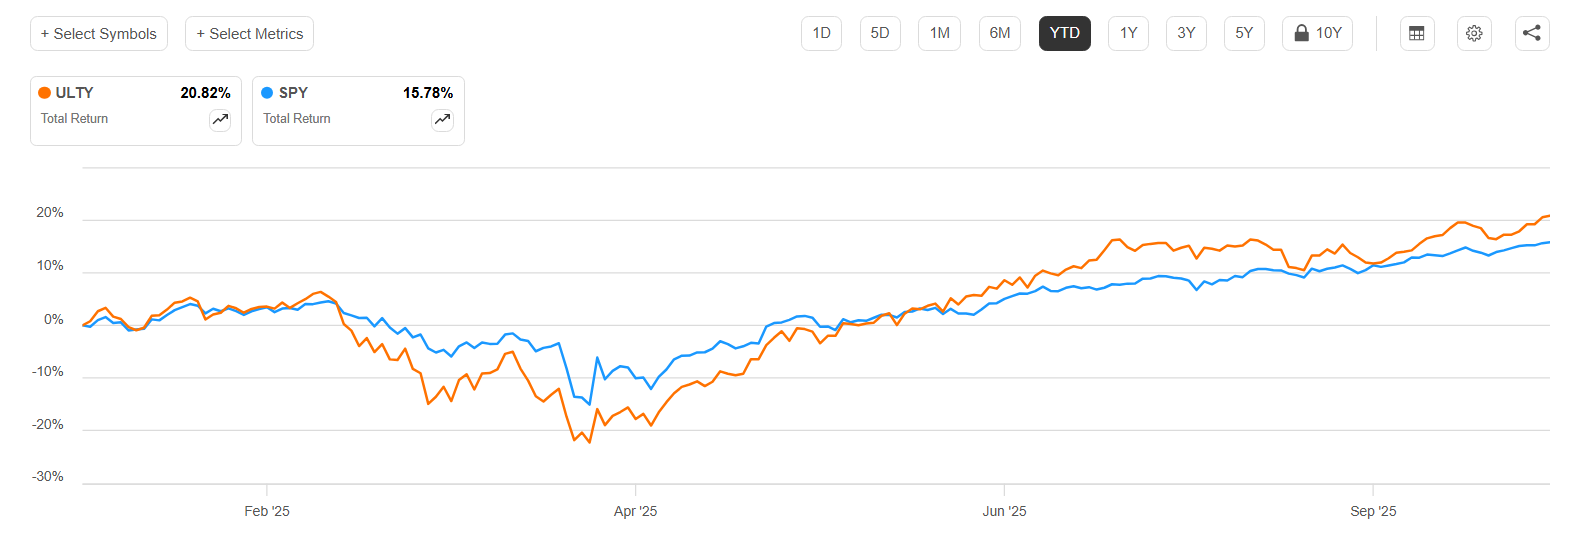
Let’s take $ULTY as an example for 2025 YTD:
Total Return: +20.82%
Price Return: –38.18%
These two charts tell the story perfectly, focusing only on price would suggest a massive loss, but the total return (including dividends) shows that the fund is actually up strongly this year.
2. Understanding Return of Capital (ROC)
Return of Capital (ROC) often sparks confusion among investors, especially in high-yield ETFs. Many assume it means the fund is “paying back your own money,” but that’s not always true. In reality, there are two very different forms of ROC and $ULTY offers a perfect real-world case study.
Destructive ROC (the bad kind)
Happens when a fund pays out more than it earns, effectively returning part of your principal.
Leads to a steadily falling NAV and smaller future payouts.
A red flag signaling an unsustainable income strategy.
Constructive ROC (the good kind)
Common in option-writing ETFs and funds with unrealized gains.
Mostly an accounting effect, not a sign of financial weakness.
Tax advantage: Constructive ROC is usually tax-deferred, lowering your cost basis and postponing taxation until you sell.
Using $ULTY as a Real Example:
According to YieldMax’s official data from August 29 2025:
Distribution Rate: 86.01 %
Composition: 87.18 % income and 12.82 % Return of Capital
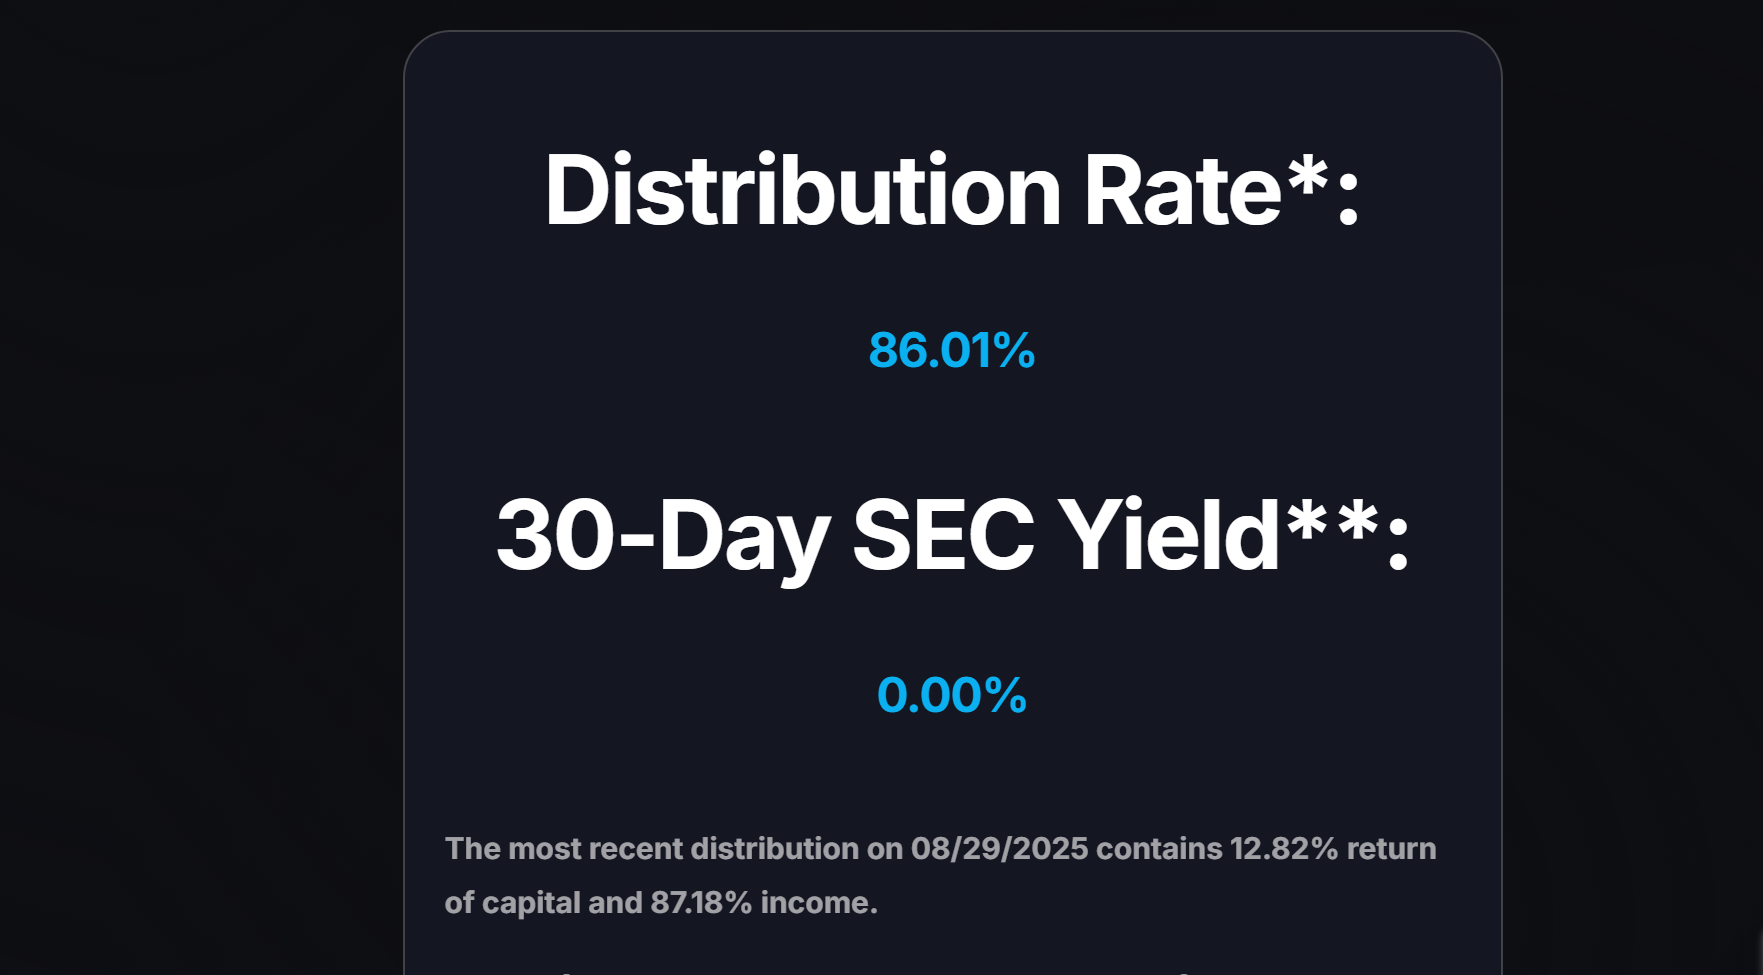
This composition clearly indicates that $ULTY’s ROC is constructive, not destructive. The majority of payouts come from the fund’s options income, while the small ROC portion simply adjusts for timing and tax treatment.
Weekly Payout Stability: More Evidence of Constructive ROC
Another way to identify constructive ROC is by checking the consistency of distributions over time.
Snowball Analytics’ payout history shows $ULTY has maintained steady weekly dividends around $0.09 – $0.10 per share throughout 2025 with no sign of shrinking payments.
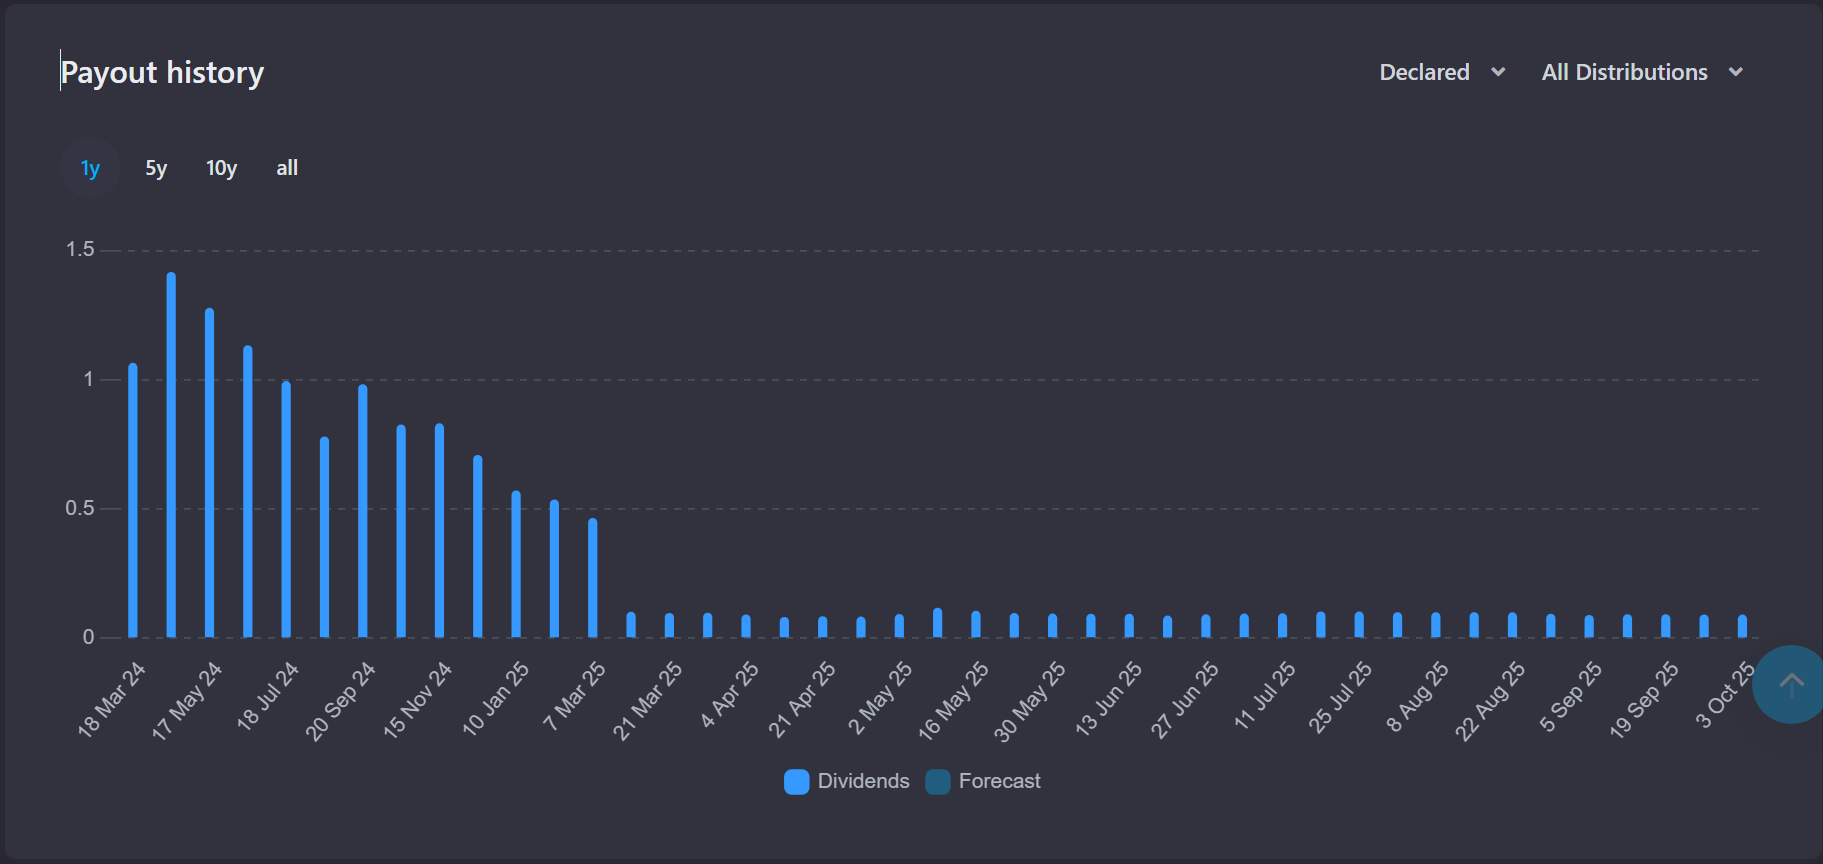

If ROC were destructive, those payouts would decline month after month as capital eroded. Instead, they’ve stayed stable, reinforcing that ULTY’s ROC classification reflects tax treatment, not a deteriorating strategy.
Takeaway
When ROC appears alongside stable or rising distributions and positive total returns, it’s constructive, a tax-efficient way to deliver income.
When ROC coincides with declining NAV and shrinking payouts, it’s destructive, a sign of real erosion.
With Snowball Analytics, investors can easily distinguish between the two by tracking both income stability and total-return performance side-by-side.
3. Reverse Splits: Cosmetic, Not Catastrophic
Reverse splits often sound alarming, but they’re sometimes just cosmetic adjustments.
What happens:
A reverse split reduces share count and increases share price proportionally.
For example, in a 1-for-2 reverse split, 1,000 shares at $5 become 500 shares at $10, the total value remains the same ($5,000).
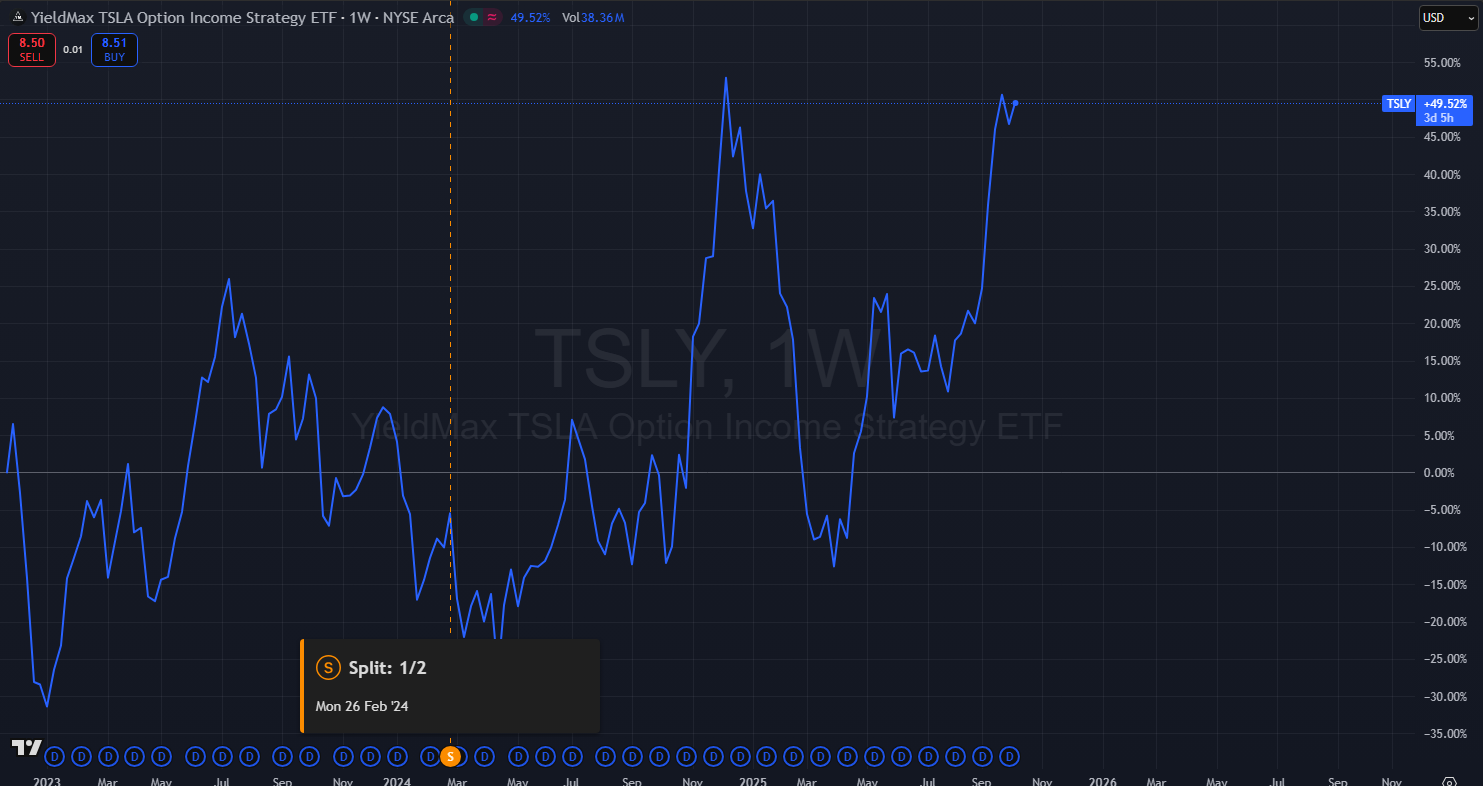
Real-World Example: $TSLY (YieldMax Tesla Option Income ETF)
In February 2024, $TSLY executed a 1-for-2 reverse split, meaning every two shares became one while the price doubled.
An investor who held 1,000 shares at $5 each ($5,000 total) ended up with 500 shares at $10 each, still $5,000 in value.
How to Interpret It
For individual stocks, a reverse split can be a warning sign, often done to avoid delisting after a steep decline.
For high-yield ETFs, it’s usually a technical adjustment, not a sign of trouble. These funds can see lower prices simply because of large ongoing distributions or short-term weakness in the underlying asset.
Even so, investors should analyze the underlying holdings and income strategy. If the fund keeps losing value or its distributions shrink, that split may be highlighting deeper issues rather than optics.
Why They Happen
To avoid delisting if price drops below exchange minimums (typically $1).
To improve fund perception, higher prices can attract more investors.
To tighten bid-ask spreads and improve trading efficiency.
Sometimes to prepare for structural or corporate actions.
What Truly Matters
The split itself doesn’t affect your investment’s value, it’s simply an accounting change.
What really matters is the performance of the underlying assets, the stability of distributions, and the total return of the fund over time.
4. The Takeaway for Investors
 Focus on total return after taxes and fees, that’s the real scoreboard.Remember that price charts alone can paint an incomplete picture.Learn the difference between constructive and destructive ROC. Reverse splits can be cosmetic, not a death sentence for a fund.
Snowball Analytics makes all of this easy to see by combining income, price movement, and tax effects into one clear total-return view.
In short:
High-yield ETFs aren’t as mysterious as they seem. Once you understand NAV, ROC, and reverse splits, you see that the real power lies in total return, the complete picture of income and growth working together.