
Investing in dividends goes hand in hand with proffering long-term wealth and passive income generation. As your portfolio grows and spreads out over different brokers, markets, and payout dates, it may soon become a hard task to monitor each and every dividend, reinvestment, and payout trend—especially when using spreadsheets for the entire management.
However, the bright side of the situation is that nowadays, investors’ monitoring, reinvesting, and compounding of incomes have been radically changed by the dividend tracking apps and analytic dashboards. No matter the reasons, whether you are seeking to maximize yield-on-cost, project annual passive income or visualize the “snowball effect” in real time, the digital tools allow you to do all this and much more all within the easiest way ever.
This guide walks through exactly how to track your dividend portfolio, measure reinvestment performance, and grow passive income smarter—without the hassle of endless manual updates.
Why Tracking Dividends Matters More Than Ever
Dividend investing isn’t just about which stocks you buy; it's about what you do with the dividends once they’re paid.
Tracking matters for three reasons:
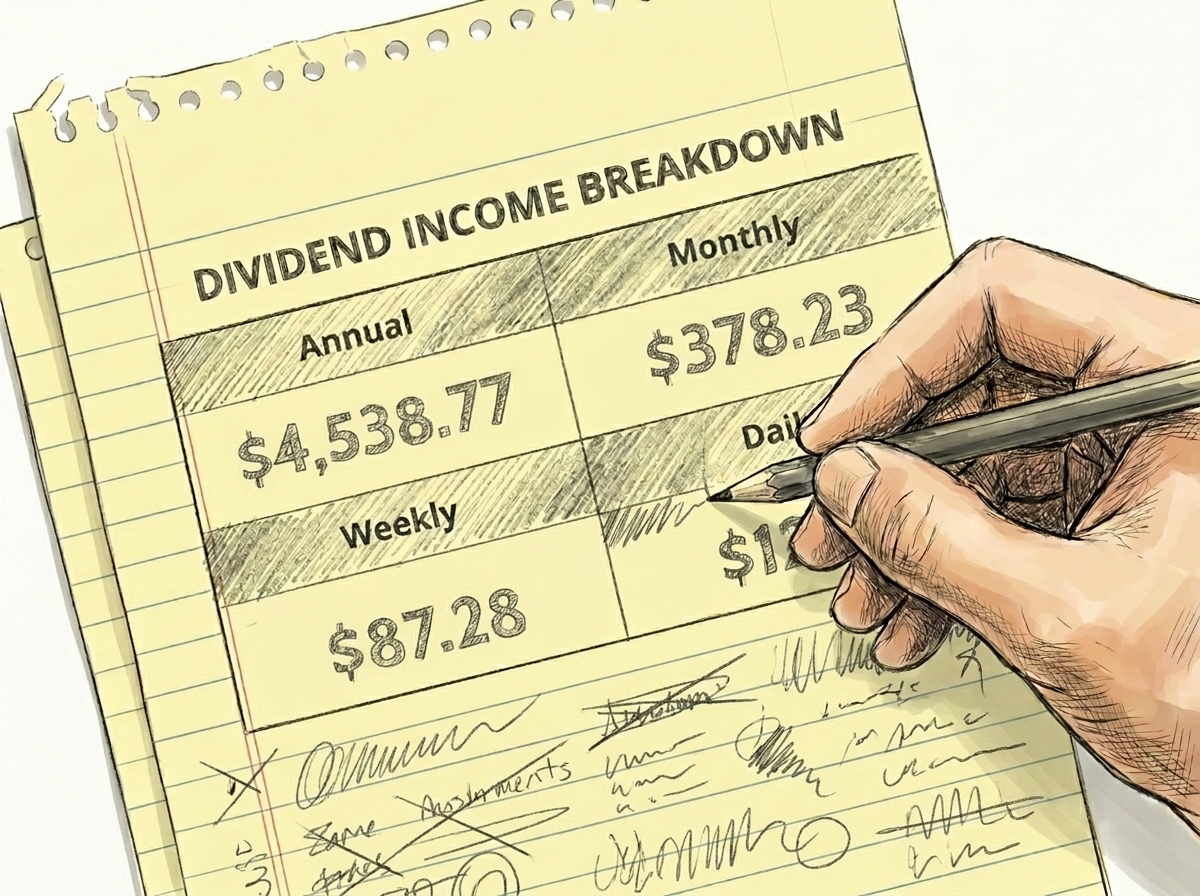
Visibility: You can’t optimize what you don’t measure. Knowing when and how much you’re earning in dividends lets you project real income and compare it against goals.
Discipline: Seeing your dividend snowball grow encourages you to hold quality companies longer and reinvest consistently.
Optimization: Tracking data helps you identify which positions deliver reliable payouts, which are at risk of cuts, and where reinvested capital truly compounds fastest.
If you’re serious about passive income, every dividend dollar should have a purpose—and a data trail.
The Major Pain Points of Manual Dividend Tracking
Most investors start with a spreadsheet. It feels efficient at first—until the complexity of dividend investing catches up.
Here are the most common issues with using Google Sheets or Excel to manage dividends:
Data fragmentation: Different brokers pay out on different schedules, often with tax withholding, DRIP reinvestments, or currency conversions. Manual updates become inconsistent.
Lack of automation: You must enter every dividend payment, split adjustment, or reinvestment transaction by hand. Miss one, and your data skews.
Calculation headaches: Yield on cost, payout ratio, annual income projections—all require formulas that break whenever you update rows wrong.
No visualization: A spreadsheet rarely captures the motivating “snowball effect”—how reinvestments drive compounding returns over time.
Tax tracking: Calculating total dividends received for different accounts (retirement vs. taxable) gets messy fast.
A single error can make months of updates unreliable. That’s why thousands of dividend investors are shifting toward automated dividend tracking apps that handle the data updates, analytics, and reinvestment logic for you.
The Rise of Smart Dividend Tracking Apps
In the same way stock screeners transformed how traders find opportunities, dividend tracking apps now give income investors a new edge. Automating your record-keeping unlocks better analytics, simplified tax prep, and a clear picture of your compounding returns.
Key features that set dedicated tools apart from spreadsheets include:
Automatic portfolio syncing: Connect your broker accounts securely to sync trades and payouts in real time.
Reinvestment tracking: See how dividend reinvestments (DRIPs) increase your share count and income growth rate.
Cash flow calendars: Visualize upcoming dividend payments by stock, date, or account.
Annualized metrics: Review yield on cost, current yield, and dividend growth trends without manual entry.
Historical performance: Compare your total return with and without reinvestment.
Apps like Snowball, Dividend Radar, Sharesight, and Simply Safe Dividends each provide versions of these features, helping investors replace clunky spreadsheets with intuitive dashboards.
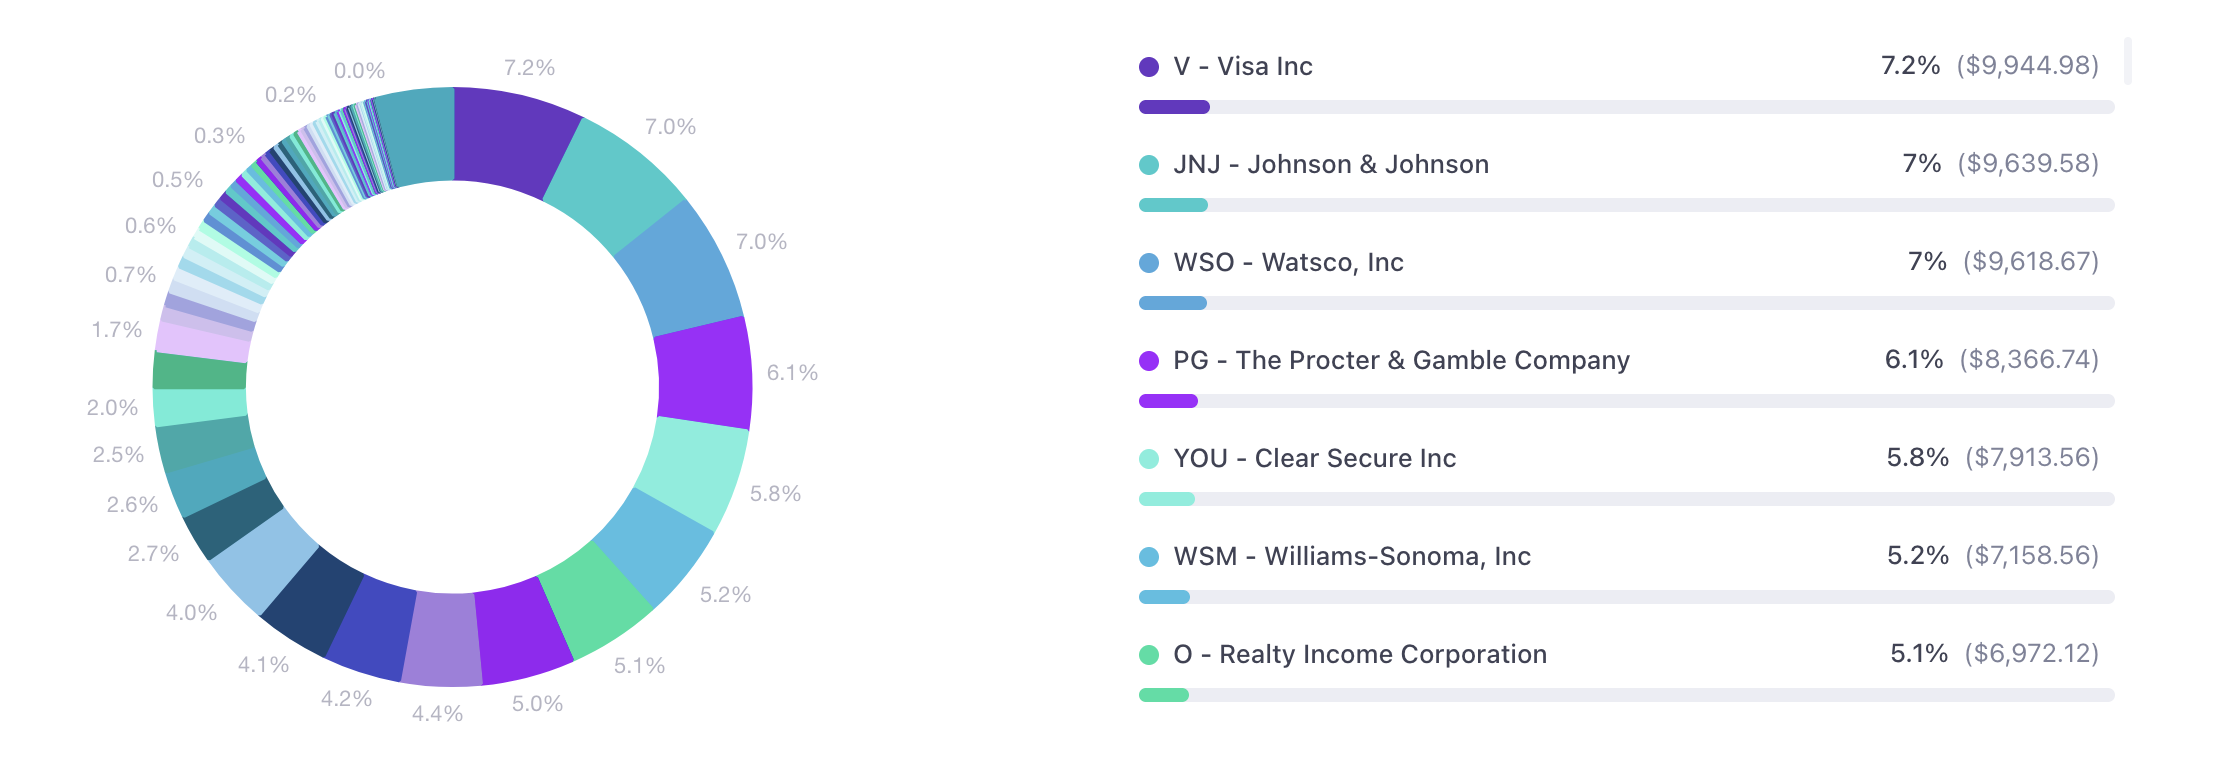
Inside the Dividend Snowball Dashboard: Tracking Reinvestment Compounding in Real Time
Let’s use Snowball—a dividend tracking app known for its reinvestment visualization—as an example of how investors can modernize their income tracking.
With Snowball’s dashboard, dividend investors can:
Import holdings automatically from major brokers or manually enter ticker symbols.
Track payouts by month, quarter, or year across all accounts.
Visualize growth with graphs showing income rolling forward—your own financial “snowball” in motion.
Monitor yield on cost (YoC) dynamically as reinvestments compound.
Compare past vs. projected income to estimate next year’s expected cash flow.
The “snowball” name reveals the principle behind the design: reinvested dividends add incremental shares, which in turn increase future dividends. The larger your snowball gets, the faster it grows downhill.
This visual model keeps investors emotionally engaged—something spreadsheets rarely achieve.
What Smart Dividend Trackers Help You Analyze
Dividend investing thrives on two disciplines: data consistency and long-term patience. Great tools reinforce both by giving you accurate, easy-to-digest analytics.
Here are the critical metrics every dividend investor should track:
1. Yield on Cost (YoC)
Yield on Cost (YoC) tells you how much dividend income you earn each year compared to the amount you originally invested in a stock. It’s calculated as:
YoC = (Annual Dividend Income ÷ Initial Investment) × 100
For example, if you bought shares for $1,000 and they pay $50 in dividends per year, your YoC is:
50 ÷ 1000 × 100 = 5%
The interesting part is that YoC can grow over time, even if the stock price doesn’t rise. This happens because when you reinvest your dividends, you buy more shares. These extra shares generate additional dividends, so your total income relative to your original investment increases. This is basically compounding at work: your money keeps generating more money.
2. Payout Stability
Not all dividends are equal. Tracking payout stability over time reveals which companies reliably return cash to shareholders and which fluctuate or risk cuts.
Look for tools that chart years of dividend history, payout ratios, and management’s consistency in increasing distributions.
3. Dividend Growth Rate (DGR)
The DGR tells you how quickly your income expands annually, independent of price swings.
Apps that automatically calculate the 3-, 5-, and 10-year DGRs let you see whether your portfolio’s income potential is accelerating or stagnating.
4. Reinvestment Results
Reinvestments power true compounding. The best apps let you isolate returns generated solely by reinvested dividends versus price appreciation.
You can visualize how many extra shares and additional income each reinvestment generated—vital for understanding compounding velocity.
5. Forward Dividend Income
Knowing what’s already earned is less useful than seeing what’s on track to be earned.
Forward income projections help you plan for financial independence milestones, from covering monthly bills to replacing a full salary.
How to Transition from a Spreadsheet to an App
If you’re still tracking dividends manually, here’s how to migrate smoothly:
Export your current data: Download your spreadsheet into a standard format (CSV or Excel). Keep columns for ticker, shares, dividend amount, and payout dates.
Choose your tracking app: Compare a few top-rated tools based on whether you want automation (via brokerage sync) or privacy (manual-only entry).
Import your data: Most platforms let you upload your CSV file; others provide data migration help for popular brokers.
Audit for accuracy: Review imported positions and ensure past payouts align with your broker statements.
Activate reinvestment tracking: Turn on DRIP tracking or automatic reinvestment simulation to watch your snowball effect begin.
Once everything’s running, your dashboard effectively replaces dozens of spreadsheet tabs.
Actionable Tips for Smarter Dividend Growth
Tracking tools alone don’t make income grow—you do. Here are practical steps to maximize your results once you’re tracking dividends effectively:
Reinvest Automatically When Possible
Enrolling in DRIP programs compounds your income invisibly and efficiently. Automation eliminates behavioral drag (like deciding whether to reinvest) and keeps your capital compounding continuously.
Review Yield on Cost Quarterly
Set a quarterly reminder to examine your YoC across positions. Prioritize adding to stocks with sustainable, rising payouts instead of simply high current yields.
Track Payout Ratios and Free Cash Flow
Use your tracking app’s analytics to cross-check payout ratios. A payout ratio consistently above 80% may signal an unsustainable dividend policy, especially during downturns.
Diversify Across Sectors
A strong dividend portfolio spans industries like utilities, healthcare, financials, and consumer staples. Apps that tag each holding by sector help you identify overconcentration.
Monitor Dividend Announcements
Enable notification alerts for dividend declarations or changes. Early awareness of reductions lets you adjust before yield-to-risk ratios erode returns.
Project and Celebrate Milestones
Most investors underestimate how motivating it is to see real progress. Watching monthly income rise from $100 to $300 to $1,000 turns finance into momentum. Apps that visualize these steps help maintain consistency.
The Psychological Edge of Tracking Your Snowball
Dividend growth investing rewards patience. Yet even disciplined investors can lose focus when returns seem slow.
That’s why visual progress tracking is vital. It transforms abstract financial goals into visible achievements:
Monthly payout charts highlight steady progress even in market downturns.
Compounding projections show how reinvested dividends accelerate growth.
Goal trackers quantify how close you are to income targets (e.g., covering your internet bill purely with dividends).
In behavior finance, this is called positive reinforcement. Tracking makes patience feel productive.
Choosing the Right Dividend Tracking App
Not all tracking platforms serve the same type of investor. Compare them based on your needs:
Snowball | Visual learners who want reinvestment tracking and projections | Snowball charts, DRIP analysis, forward income |
Sharesight | Multi-account international investors | Tax reporting, foreign dividend tracking |
Simply Safe Dividends | Risk-focused investors | Dividend safety scores, payout ratio analysis |
Dividend Radar | Spreadsheet-inclined users wanting hybrid use | Google Sheets integration, basic automation |
Choose an app that aligns with your workflow. Some investors prefer a visual dashboard like Snowball; others want research-heavy insights like Simply Safe Dividends.
The Future of Dividend Portfolio Tracking
Dividend investors increasingly expect AI-driven analytics, predictive income modeling, and even portfolio optimization recommendations. Future apps will likely integrate:
Smart reinvestment suggestions: Where to deploy your next dividend for the best compounding potential.
Automated tax efficiency: Tagging which dividends are qualified vs. non-qualified for optimal reinvestment planning.
Cross-broker synchronization: Aggregating global accounts for one unified income dashboard.
Portfolio risk detection: Flagging overexposure to single payers or vulnerable sectors.
As these innovations evolve, dividend investing will become even more data-driven—and investors who adopt smart tools early will gain a measurable edge.
Final Takeaway: Build Your Dividend Snowball Smarter
Dividend investing isn’t static income; it’s a self-reinforcing system of growth. But without precise tracking, even the best portfolio underperforms its potential.
Replacing manual spreadsheets with modern dividend tracking apps like Snowball or Sharesight lets you monitor yield-on-cost, reinvest intelligently, and watch your passive income snowball faster.
Automation doesn’t just save time; it clarifies what’s working, encourages smarter reinvestments, and keeps you connected to your long-term mission—financial freedom financed by dividends.
Your toolkit now includes data, discipline, and visualization. The next step is simple: track your dividends smarter, reinvest continuously, and let time and technology do the compounding.