
I’d like to briefly re-introduce the most popular dividend stocks for those who aren’t familiar. There’s a group of companies that have paid and raised dividends for decades. In 2025, interest in them picked up again: many of these names have already rallied on the back of resilient results and expectations of a softer monetary policy.
For investors, they’re a reliable reference point: these businesses have lived through multiple cycles and kept a disciplined approach to payouts. Some of these stocks will be in my portfolio. But a strong run is not a reason to switch off common sense. A long dividend history helps you find sturdier companies, yet price still matters.
In this piece, I’ll look at how to approach them today: where dividends are backed by real cash flow, where share prices may have run ahead of fundamentals, and how to use this list so it works for your goals—not against them. After reading the article, let me know which of these stocks you own.
Who are Dividend Kings
Dividend Kings are companies that have increased their dividend payments every single year for at least 50 consecutive years. It’s a rare club: these businesses have weathered downturns, crises, and interest-rate cycles, yet still found the cash each year to lift the payout, even if only by a step.
They’re typically large, resilient companies with straightforward business models and steady cash generation. They tend to keep debt at reasonable levels, manage costs consistently, and fund dividends from current revenue and free cash flow.
There are limits to keep in mind. A long payout history doesn’t guarantee future returns; stock prices still depend on demand and business results. Before buying, check what actually funds the dividend, whether revenue is growing, and whether the valuation looks overheated. For many investors, Dividend Kings can form a durable core of the portfolio, but it’s still best to make a quick numbers check before deciding.
Dividend Kings list for 2025
To avoid mistakes and keep the list accurate, it’s better to rely on maintained, regularly updated sources. Up-to-date registries for 2025 are available at Investing Stock Market (with criteria and examples) and at kiplinger.com (which maintains a full list with analysis on each name). I use these materials as the base for our table and for quick data checks.
Company (Ticker) | Sector | Dividend Yield (Nov 12) | Years of Increases |
ABM Industries (ABM) | Industrials – Services | 1.8% | 58 |
AbbVie (ABBV) | Healthcare – Pharmaceuticals | 3.6% | 53 |
Altria (MO) | Consumer Staples – Tobacco | 7.2% | 56 |
American States Water (AWR) | Utilities – Water | 2.7% | 71 |
Archer Daniels Midland (ADM) | Consumer Staples – Agricultural Commodities | 3.5% | 51 |
Becton Dickinson (BDX) | Healthcare – Medical Equipment | 2.2% | 52 |
Cincinnati Financial (CINF) | Financials – P&C Insurance | 2.1% | 64 |
Commerce Bancshares (CBSH) | Financials – Regional Banks | 2.0% | 57 |
Colgate-Palmolive (CL) | Consumer Staples – Household Products | 2.6% | 62 |
Coca-Cola (KO) | Consumer Staples – Beverages (Non-Alcoholic) | 2.8% | 63 |
Dover (DOV) | Industrials – Equipment | 1.3% | 68 |
Emerson Electric (EMR) | Industrials – Electrical Equipment | 1.7% | 67 |
Farmers & Merchants Bancorp (FMCB) | Financials – Regional Banks | 2.0% | 60 |
Federal Realty (FRT) | Real Estate – Retail REIT | 4.6% | 56 |
Genuine Parts (GPC) | Consumer Discretionary – Auto Parts Distribution | 3.2% | 68 |
Hormel Foods (HRL) | Consumer Staples – Food | 5.1% | 59 |
H.B. Fuller (FUL) | Materials – Specialty Chemicals | 1.6% | 54 |
Illinois Tool Works (ITW) | Industrials – Equipment | 2.6% | 62 |
Johnson & Johnson (JNJ) | Healthcare – Pharma & Consumer Health | 2.7% | 62 |
Kimberly-Clark (KMB) | Consumer Staples – Household Products | 4.9% | 51 |
Lowe’s Companies (LOW) | Consumer Discretionary – DIY Retail | 2.0% | 64 |
Nordson (NDSN) | Industrials – Equipment | 1.4% | 61 |
Northwest Natural (NWN) | Utilities – Gas | 4.1% | 69 |
Parker-Hannifin (PH) | Industrials – Components & Systems | 0.8% | 68 |
PPG Industries (PPG) | Materials – Coatings & Paints | 3.0% | 54 |
Procter & Gamble (PG) | Consumer Staples – Household Products | 2.9% | 68 |
Stanley Black & Decker (SWK) | Industrials – Tools | 4.9% | 56 |
SJW Group (SJW) | Utilities – Water | 2.0% | 57 |
Stepan (SCL) | Materials – Specialty Chemicals | 3.6% | 57 |
Tootsie Roll (TR) | Consumer Staples – Food | 0.9% | 58 |
Target (TGT) | Consumer Discretionary – Retail | 5.0% | 52 |
Tennant (TNC) | Industrials – Equipment | 1.7% | 52 |
California Water Service (CWT) | Utilities – Water | 2.6% | 56 |
Black Hills (BKH) | Utilities – Multi-Utility | 3.8% | 53 |
I’ll take a closer look at the top 5 Dividend Kings from this list for 2025—what they do, what drives growth, and the dividend outlook.
Procter & Gamble (PG)
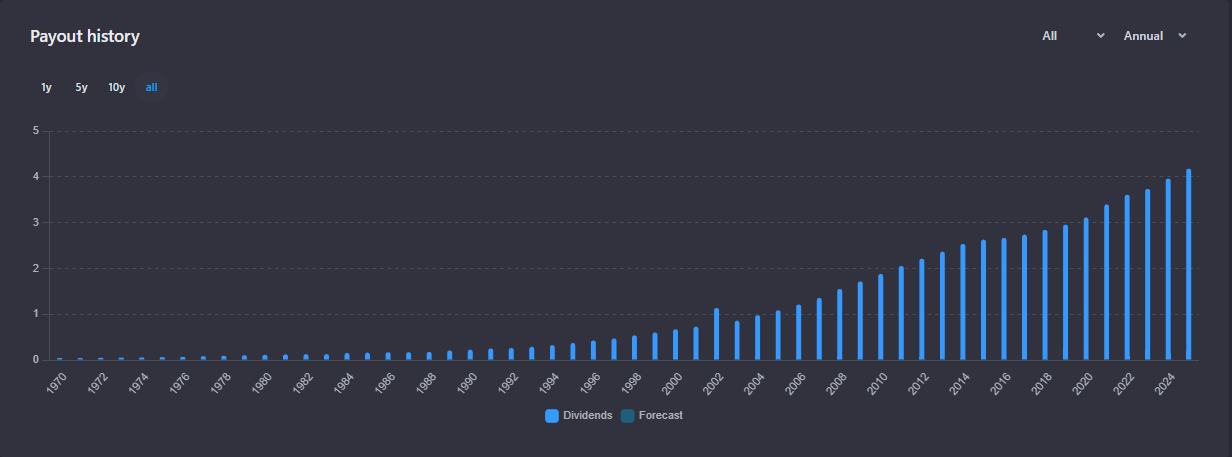
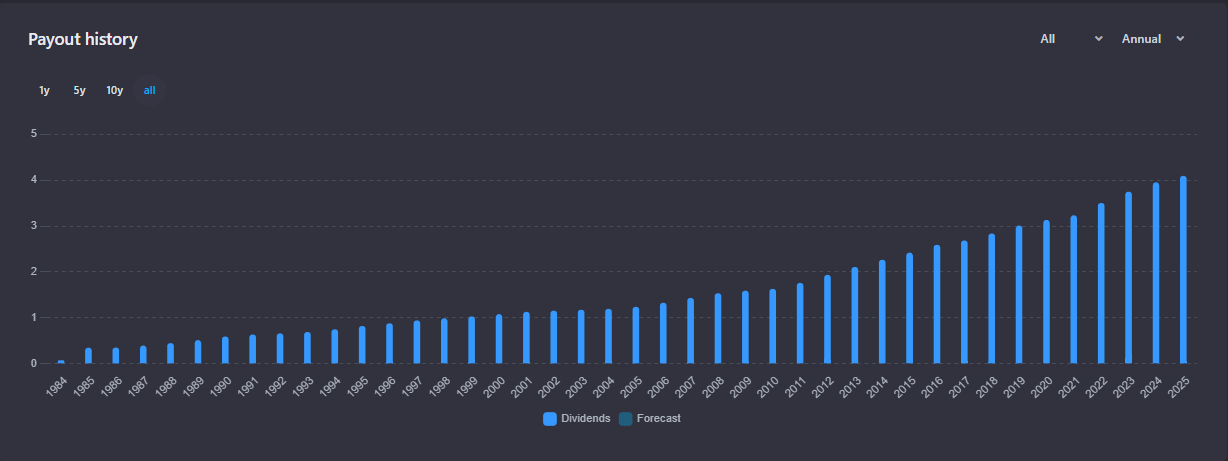
One of the most resilient consumer-staples companies—home care, hygiene, and personal care (see P&G overview). P&G handled higher input costs and shipping issues by refreshing products and making careful price increases without big volume losses. Cash flow stays steady (see PG financials), which supports regular dividend raises: today the annual Procter & Gamble dividend is about $4.23 per share with a ~2.88% yield, paid quarterly. On basic numbers, P&G’s earnings per share over the last year are about $6.53, with the company expected around $7.00 over the next year. The stock trades at a price-to-earnings ratio of ~22.5 based on last year’s earnings (about ~21 on next year’s). Volatility is low: the beta is ~0.36 (lower than the market). The latest quarter (ended Sept 30, 2025) came in better than expected, with earnings beating by ~4.7% and revenue by ~1.0%, matching the story of modest growth and improving margins after the choppy 2022–2023 period (see P&G news and pginvestor.com). For long-term investors, this remains a core holding with dividends backed by real cash generation.
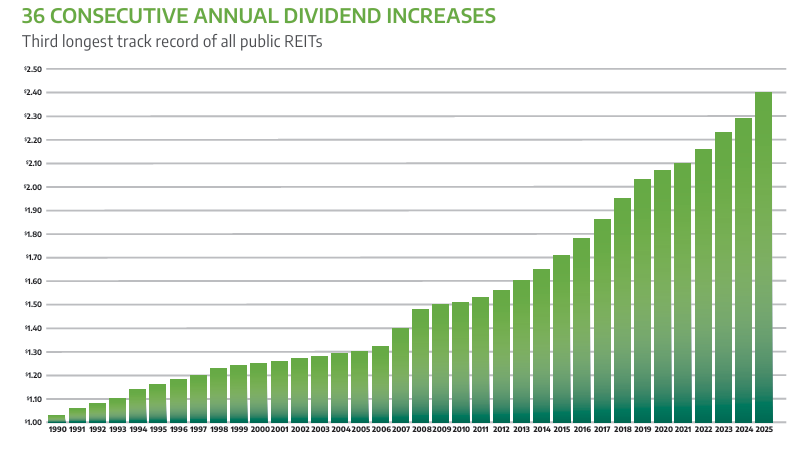
Dividend payments at Procter & Gamble over 54 years
PepsiCo (PEP)
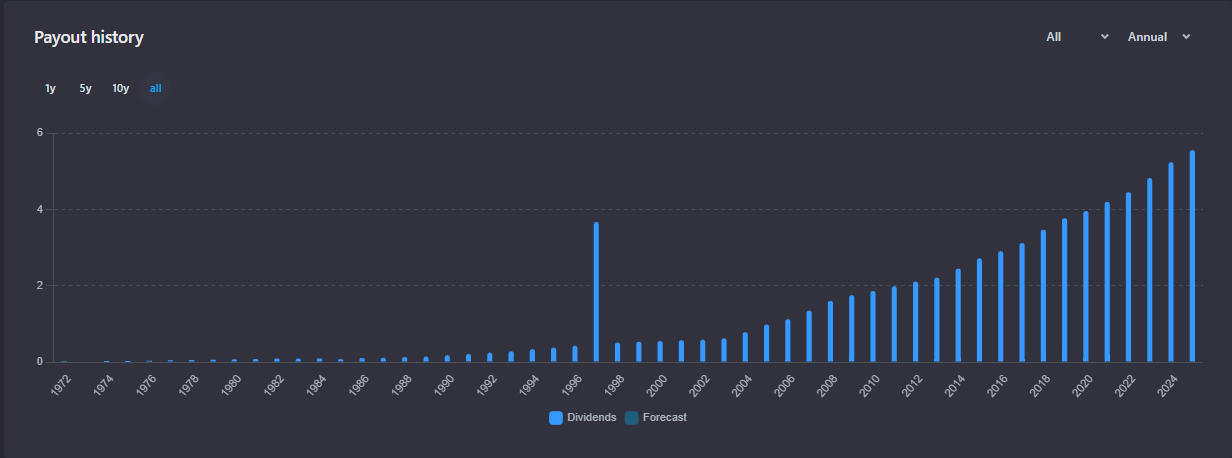
The mix of beverages and snacks smooths revenue across seasons and regions (see PepsiCo overview). In recent years, PepsiCo has leaned more into snacks—visible in the news—helping offset beverage ups and downs and keep margins healthy. PEP Dividends have risen for decades, and today the annual dividend run-rate is about $5.69 per share, paid quarterly, which works out to an approx. 3.98% yield at a share price around $142.95. On simple numbers, earnings per share over the last year are about $5.49, with about $8.49 expected over the next year. The stock trades at a price-to-earnings ratio of ~26 based on last year’s earnings (about ~17 on next year’s). The most recent quarter (ended September 30, 2025) was better than expected, with earnings beating by ~4.4% and revenue by ~1.9%. For a conservative portfolio, $PEP remains a model of stability, with dividends supported by a wide brand lineup and steady cash generation; investor relations: pepsico.com.
Dividend payments at PepsiCo over 53 years
Johnson & Johnson (JNJ)
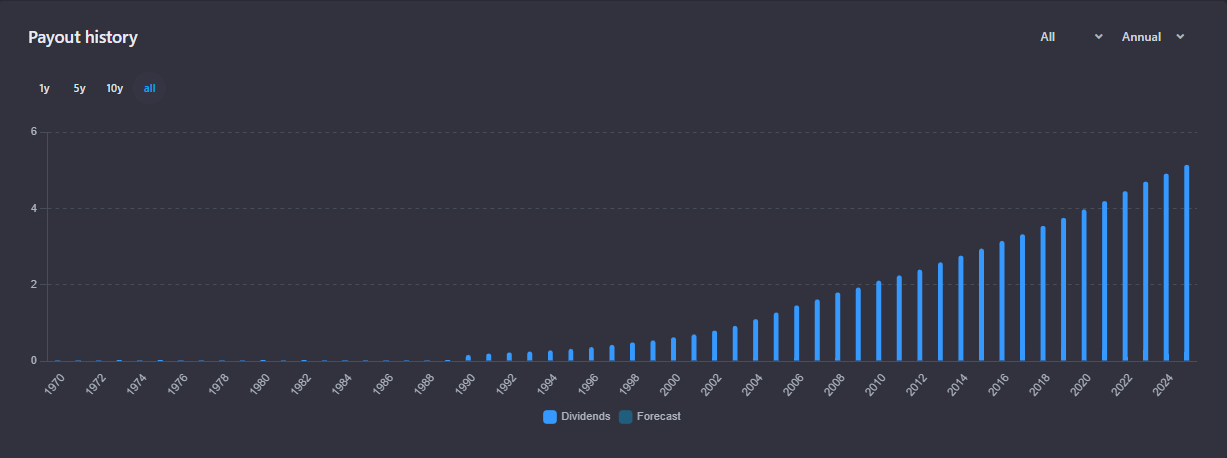
After spinning off the consumer segment in 2023, J&J became more focused—pharmaceuticals and medical devices. A couple of weak price years gave way to recovery in 2025 as key drugs progressed and devices improved. The Johnson & Johnson dividend record remains spotless: over 60 straight years of increases, with about $5.20 per share a year today and a ~2.8% yield; the next ex-dividend date is Nov 25, 2025. On simple numbers, earnings per share over the last year are about $9.33, with about $11.44 expected next year. The stock trades at a price-to-earnings ratio near 20 on last year’s earnings (about 16 on next year’s), and volatility is low (beta ~0.39). The most recent quarter (ended Sept 30, 2025) was better than expected, with earnings beating by ~3.4% and revenue by ~3.9%. Investors should track patent cliffs and new launches—these drive revenue and margins (see J&J News). In its updated shape, $JNJ looks more predictable and closely tied to core healthcare demand; investor site: investor.jnj.com.
Dividend payments at Johnson & Johnson over 55 years
Lowe’s (LOW)
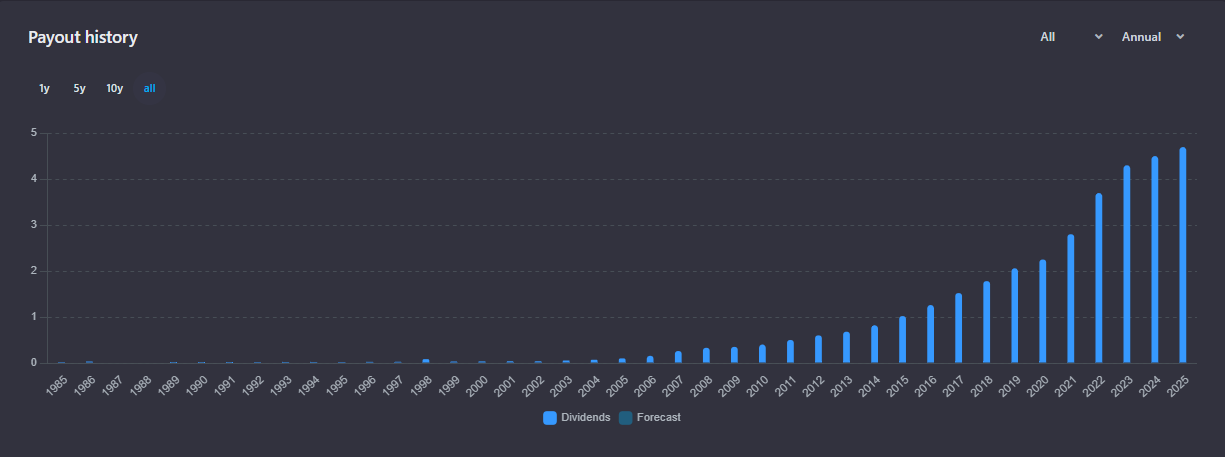
The home improvement retailer went through high volatility due to mortgage rates and a cooler housing market, but showed signs of stabilization in 2025 (see Lowe’s overview). Results improved: in the last reported quarter (ended July 31, 2025) earnings Lowe’s came in ~2% above expectations and revenue was about in line. Lowe’s keeps pushing into pro customers, improving online, and running tighter inventories, which helped margins and steady cash flow. The company pays about $4.80 per share a year (roughly 2.1% yield), quarterly, with the next ex-dividend date on Jan 22, 2026. Over the last year it earned about $12.19 per share; the street expects about $12.48 over the next year. The stock trades at about 19× last year’s earnings (also ~19× on next year’s), and it moves roughly like the market (beta ~0.88). Key drivers remain same-store sales and mortgage-rate sensitivity; as housing normalizes, there’s still room to improve (see the latest LOW news). $LOW fit for those seeking exposure to the long remodeling cycle in the U.S.; see also Kiplinger materials.
Dividend payments at Lowe’s over 40 years
Genuine Parts (GPC)
A distributor of auto parts and industrial components, GPC benefits from steady demand as cars get older and still need maintenance (see Genuine Parts overview). The company keeps adding locations, improving logistics, and moving orders online—supporting sales and profits (see financials GPC). Today it pays about $4.12 per share each year in GPC dividends, quarterly, which is around a 3.25% yield. The next ex-dividend date is December 6, 2025. Over the last year, earnings were about $5.81 per share, and the next year is expected around $8.45. The stock trades at a price-to-earnings ratio near 21.8 on last year’s earnings (about 15 on next year’s), and moves less than the market (beta ~0.77). In the most recent quarter (ended Sept 30, 2025), results were a bit better than expected—earnings beat by ~1% and revenue by ~1%. For a dividend portfolio, $GPC is a straightforward, steady payer with a simple business model; see also Kiplinger.
Dividend payments at Genuine Parts over 41 years
Why invest in Dividend Kings?
Dividend Kings won’t suit everyone, but their long history of raising payouts often reflects durable businesses worth owning. A few main reasons:
• They can be a strong component of retirement portfolios or a tool for investors seeking reliable income.
• Many of these stocks offer higher dividend yields than the average S&P 500 company.
• Consistency in paying and increasing dividends can be reassuring for investors who live on portfolio income.
Check-list for dividend investors
Start with a clear goal and time horizon. Decide whether you want payouts for regular income or long-term growth through reinvestment. Dividend Kings are companies that have raised payouts for many decades; major publications and research services maintain lists and explanations.
What to check for each company:
• Dividends covered by cash (payout to FCF). Look at the share of free cash flow used for dividends. If it’s no more than ~60–70%, the company has room for investment, debt service, and downturns. Near 100% is a warning: any cash dip puts the payout at risk.
• Revenue and operating profit. Investors want a business that isn’t shrinking. If revenue and operating profit don’t fall for 2–3 years in a row—and ideally grow—that’s a healthy sign. A long downtrend is a cue to trim.
• Margins (gross and operating). Strong businesses keep margins steady or gradually improving. Big quarter-to-quarter swings often signal weak pricing power or cost control. Stable margins = more predictable cash for dividends.
• Debt and interest. Debt should be manageable: interest easily covered by earnings, with no major maturities looming in the next 1–2 years. That reduces the odds of dividend cuts in volatile markets.
• Earnings quality. If you want profits that turn into cash: FCF close to net income, with working capital (inventory, receivables) not ballooning without good reason. Paper profits without cash are a weak base for payouts.
• Capital structure without persistent dilution. The share count shouldn’t creep up year after year due to heavy stock-based comp or issuance. Buybacks only count if the share count actually goes down.
• Yield and valuation. Compare dividend yield and cash yield (FCF yield) to the company’s own history and its sector. If yields are much lower than usual and multiples (P/E, EV/EBITDA) are higher without clear justification, you might be paying for the story rather than future cash.
Two Common Investor Paths
Individual stocks. Pick specific Kings and set your own weights. Best for investors ready to review quarterly reports, monitor FCF coverage, margins, and debt. Pros: control and the ability to fine-tune yield and sector risk. Cons: time and discipline. A practical start: 10–20 names across sectors, position limits, and regular rebalancing.
Funds focused on dividend kings. One purchase gives a basket of reliable payers with long raise streaks. Pros: diversification, simplicity, time savings. Cons: fund fees and less flexibility. What to check: selection methodology, expense ratio, payout frequency and stability, and top-holding concentration.
How to choose
If you want a simple, dependable base, start with a fund. If you want to fine-tune yield and structure, add individual stocks on top. This blended approach balances simplicity with control.
How to size positions
Don’t pile into one or two holdings. Spread positions across sectors and review monthly or quarterly. If payout coverage or leverage worsens meaningfully, adjust the weight.
Remember
Even Dividend Kings can be volatile. Dividends add to total return, but they don’t guarantee against drawdowns.
Conclusion
Dividend Kings aren’t quick trades—they’re a foundation for the long term. Companies that have raised payouts for 50+ years usually get through crises thanks to steady cash flows and disciplined finances. Amid market swings and shifting inflation, they often show steadier performance and help smooth portfolio drawdowns, as noted by outlets that track this list.
But the approach still requires selectivity: a reliable dividend doesn’t replace checks on growth, leverage, and a sensible price.
The Kings list is a strong base for long-term income, but it works best with your own analysis and periodic rebalancing aligned with rates, inflation, and your risk tolerance.
Tell me which of these securities you hold and why you added them to your portfolio?