

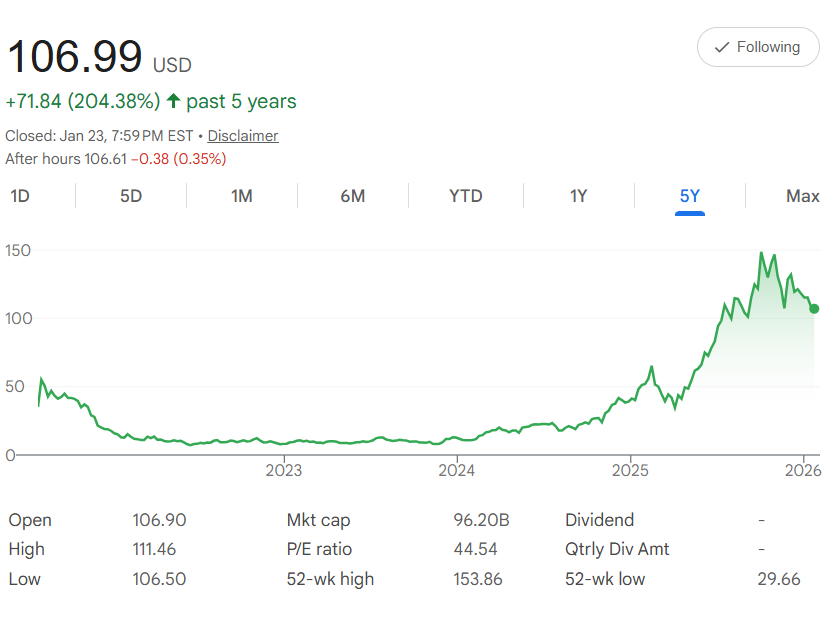
Five years ago, Robinhood Markets $HOOD shares were trading around $35.15 each (post-IPO adjustment). Today, it's closed at $106.99—a sturdy 204% rise that comes from its growth as a commission-free trading app, expanding to crypto, retirement accounts, and international users amid retail investing booms. The chart shows a volatile start from 2022 lows, with steady climbs in 2024-2025, and a 52-week high of $153.86 highlighting the peak momentum so far.
In simple terms, the compound annual growth rate (CAGR) is 24.94%. That's the average yearly boost—calculated by raising the total growth factor to the 1/5 power and subtracting 1. It means growing your money by about 25% each year, on average.
Dollar-cost averaging (DCA) keeps the path even: Invest $500 every month for five years, totaling $30,000. This buys more shares on lower days and fewer on higher ones, helping through market swings. Projecting forward at the same historical pace, with a monthly growth rate of about 1.87% from $106.99, your shares add up steadily.
Build your portfolio, one day at a time.
Get our daily 5-year horizon picks sent to your inbox. Subscribe here.
After 60 months, your total could reach $54,998. That's a gain of $24,998—a 83% return on your investment. The early buys get the most from compounding, while later ones still add to the portfolio.
This is based on the past, which isn't a guarantee ahead—fintech like HOOD can fluctuate with trading volumes, regulations, or economic shifts, but a P/E ratio of 44.54 shows growth pricing. With that 52-week high of $153.86 in view and a $96.20B market cap, HOOD has drive.
If DCA fits your steady plan, it could turn your $500 habit into a solid position by 2031. Trade smart?