 Stock Analysis
 General
 Library


 Could $500 a month in ATI grow toward $134K?
  ATI’s explosive five-year run makes the numbers fascinating—but can that pace continue?
 Hit play to uncover the growth, risks, and potential behind ATI!
Imagine setting aside $500 a month for $ATI for five years, buying a fixed dollar amount on a schedule, a method called dollar-cost averaging. In our example the buy happens on the first trading day on or after the 9th of each month, from Oct 2021 through Sep 2026 (the first buy lands on Monday, Oct 11, 2021, because Oct 9 was a Saturday): 60 buys, $30,000 in total.
ATI closed at $192.42 today, a price gain of about 1,035%, or roughly 63% a year compounded (the steady yearly rate that would give the same total gain). In that example the $30,000 would have been worth about $134,200 at the close (about 4.5 times the money put in), and a single $10,000 invested on Oct 8, 2021 would have become about $113,500. Price only: no dividends, fees or taxes, and these are examples, not forecasts.
Get daily 5-year horizon stock picks in your inbox. Long-term investing wins, and our featured stocks have already beaten the S&P 500. Subscribe now!
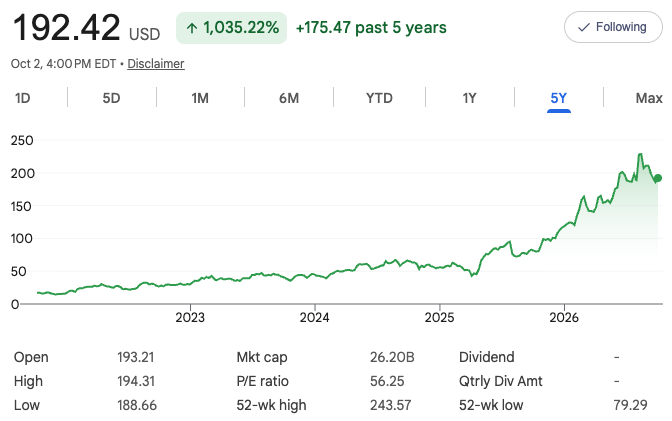
The highest close of the past 52 weeks was $231.78 on Aug 17, 2026, so the Oct 2, 2026 close sat about 17% below it. The lowest close of the five years was $14.06 on Dec 1, 2021, about 17% below the start. To keep the headline in perspective, +1,035% is only about 3% above the +1,000% line, so the headline could move with a single day's trading.
Caution: past pace rarely continues. ATI's Aug 6, 2026 release for the quarter ended Jun 28, 2026 showed sales up 11% and adjusted EBITDA (operating profit before interest, taxes, depreciation and amortization, with special items left out) up 37%, with a raised outlook (its own forecast). The stock moved from $231.78 on Aug 17 to $180.67 on Sep 28, 2026, a reminder that prices can pause even when results are strong.