 Stock Analysis
 General
 Library


 $500 a month. Five years. Could GOOG turn it into $70K+?
 Tune in to see how GOOG’s past growth could shape the numbers—and where the risks begin.
"Forecasts may tell you a great deal about the forecaster; they tell you nothing about the future."
— Warren Buffett
A fixed $500 a month ignores the forecast: same deposit, most months, whether the line is quiet or running.
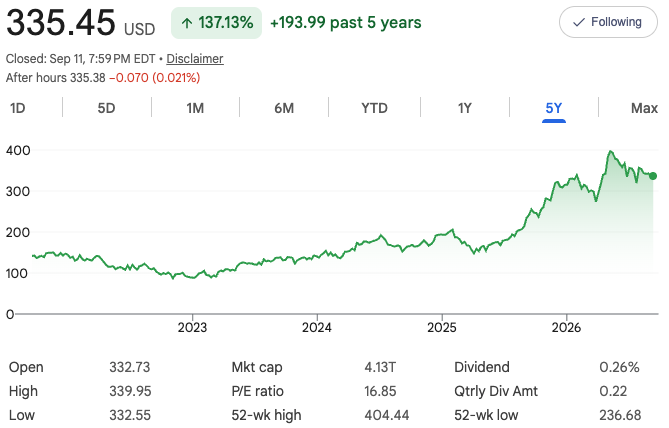
Alphabet Inc. Class C $GOOG closed at $335.45. Five years earlier it was about $141.46. That is a +$193.99 move, or +137.13% in total — roughly 18.8%/yr on average if you held the whole stretch. That pace is stronger than a typical long-run market baseline. It is unusual, and it is not a number to copy forward blindly.
Story: Soft-to-flat early years, a steady climb, then a 2026 push and a retreat from the peak.
Math: $141.46 → $335.45 · +137.13% (~18.8%/yr avg)
If $500/mo: $30k in → roughly $69,000–$73,000 if that average multiple somehow repeated (it usually does not).
Look for on the chart: the quieter 2022–2023 stretch, the later rise toward the $404.44 52-week high, and the pullback to $335.45 — DCA would have bought more shares on the earlier dips and fewer into the late strength.
Get daily 5-year horizon stock picks in your inbox. Long-term investing wins, and our featured stocks have already beaten the S&P 500. Subscribe now!
Lesson: Past pace rarely continues. A five-year annualized rate near 19% on a very large company is a result, not a plan. Past results never guarantee the future — especially after a sharp run that has already given some of it back.
Next Horizon: another verified 5-year chart, same $500/month frame, same honest catch.