 Stock Analysis
 General
 Library

 Could $500 a month in STRL grow toward $690K?
  From a massive run to a major pullback, STRL shows why patience matters.
 Hit play and see what the numbers reveal!
"It's waiting that helps you as an investor, and a lot of people just can't stand to wait." — Charlie Munger
A fixed $500 a month is a waiting tool: you keep adding on a schedule, through the base and after the drop, without needing a perfect call.
Sterling Infrastructure Inc. $STRL closed at $512.29. Five years earlier it was about $22.86. That is a +$489.43 move, or +2,140.99% in total — roughly 86%/yr on average if you held the whole stretch. That pace is extreme. It is not a forecast, and it is a poor default to project forward blindly.
Story: Years near the floor, a sharp late run, then a large giveback from the peak.
Math: $22.86 → $512.29 · +2,140.99% (~86%/yr avg)
If $500/mo: $30k in → roughly $655,000–$690,000 if that average multiple somehow repeated (it usually does not).
Look for on the chart: the long low base, the 2026 surge toward the $1,005.68 52-week high, and the slide to $512.29 (52-week low $281.58) — DCA would have bought more shares early and fewer into the spike.
Get daily 5-year horizon stock picks in your inbox. Long-term investing wins, and our featured stocks have already beaten the S&P 500. Subscribe now!
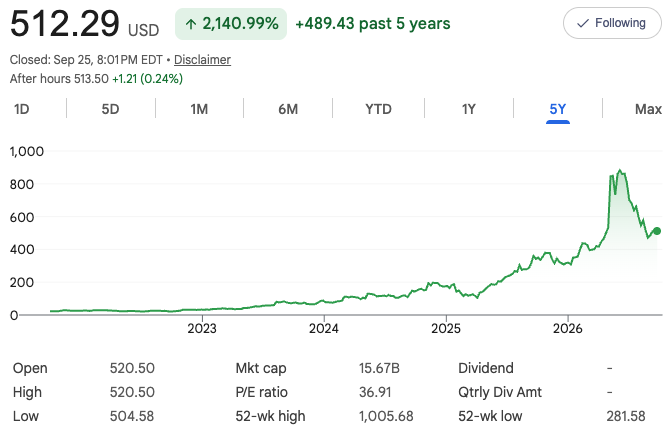
Lesson: Peak risk after a vertical run. A five-year line can stay deeply green while the recent high is already far away — here, $1,005.68 down to $512.29. Past results never guarantee the future, especially after a move this steep.
Next Horizon: another verified 5-year chart, same $500/month frame, same honest catch.