In a market flooded with income options, investors often face a different kind of risk: overcomplication. Covered call funds, corporate bond funds, preferred shares, gold, silver, government debt—each has a role. But deciding how much to allocate to each can quickly get messy.
That’s where funds of funds enter the conversation.
Two of the most popular in this space are CEFS and FOF. Both aim to simplify diversification by holding baskets of closed-end funds across multiple asset classes. But while they look similar on the surface, their structure—and recent performance—tell a slightly different story.
The Distribution Record
For income investors, consistency matters.
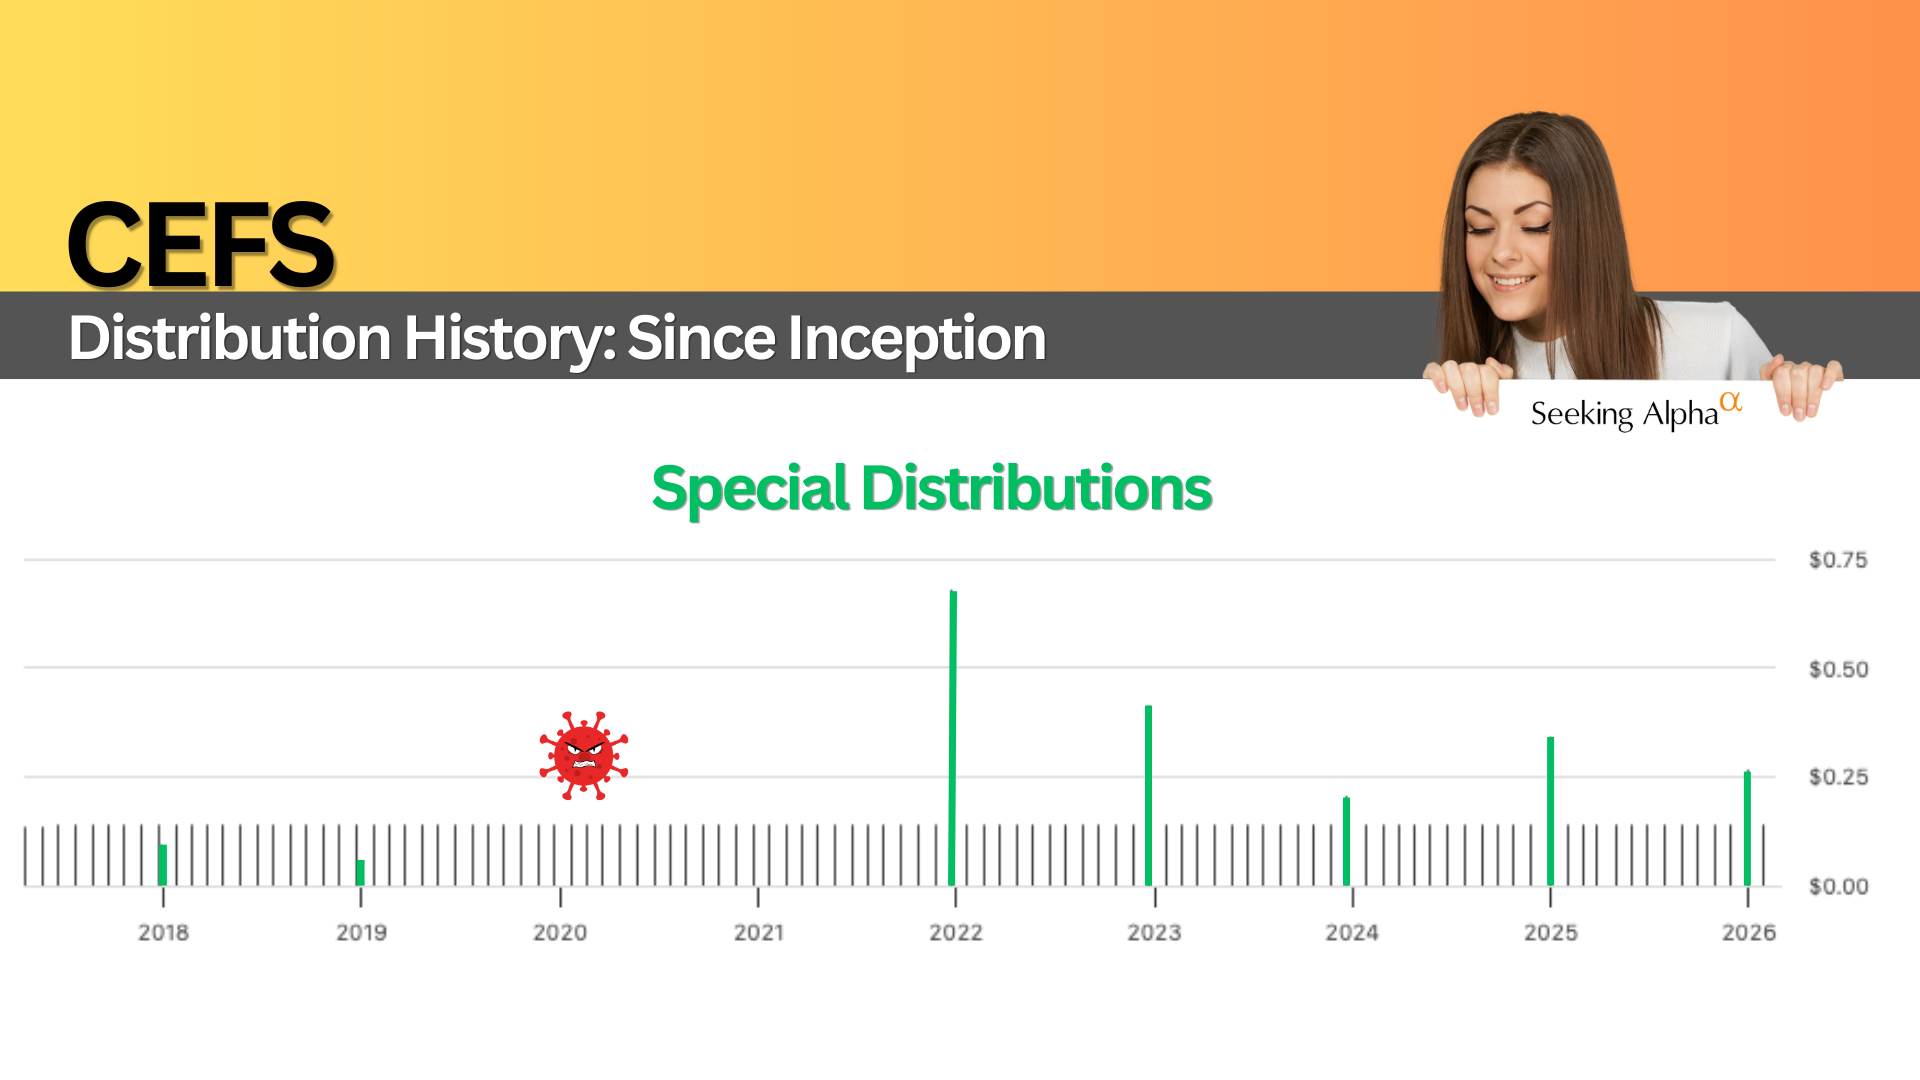
CEFS launched in 2017 and has paid $0.14 per month without interruption, including through the 2020 market shock. In some years, it has also paid special distributions in December when excess gains were realized. At today’s price, the regular payout works out to roughly 7.2%, or about 7.8% including special distributions.
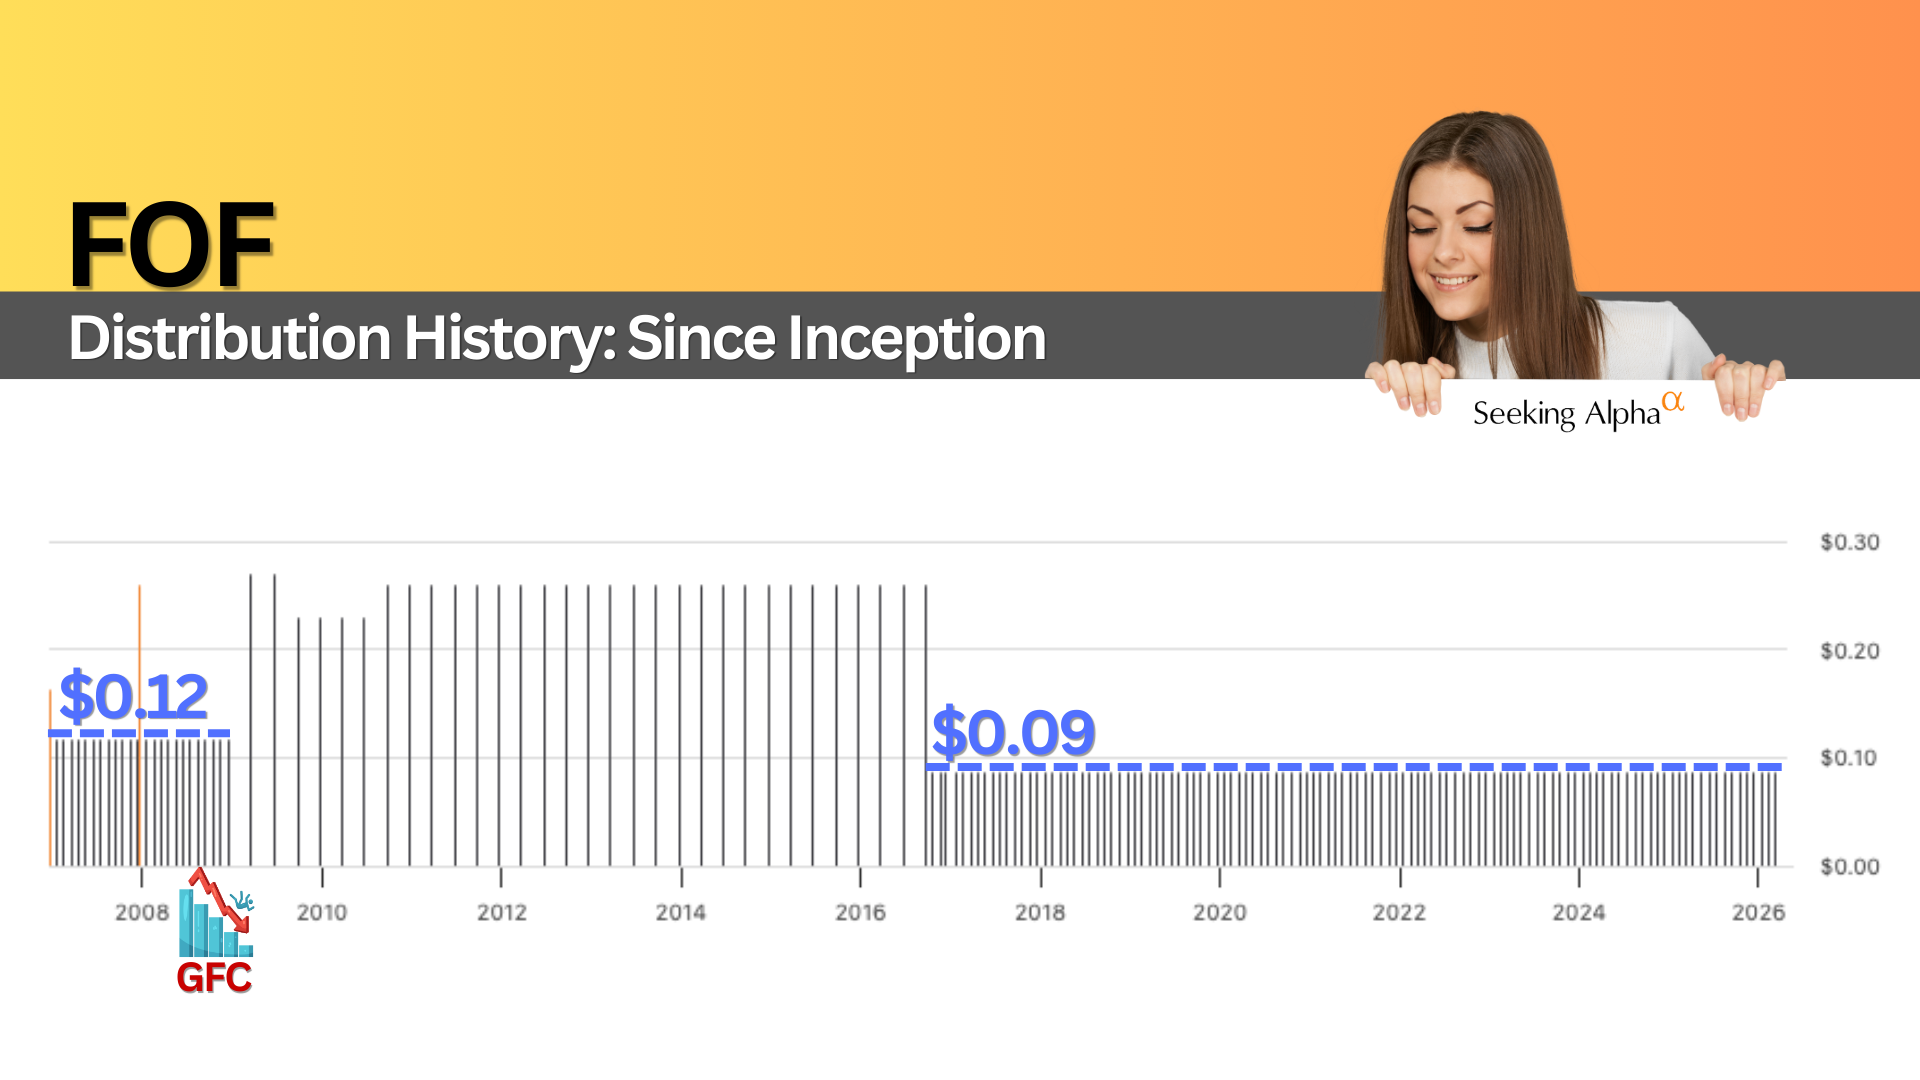
FOF goes back further, launching in late 2006, just before the Global Financial Crisis. It did cut its distribution during 2008, likely after paying out more than it could sustain. Since then, payments have been consistent. The shift between quarterly and monthly schedules can make the chart look complicated, but the underlying payout has stabilized.
What’s Under the Hood?
Both CEFS and FOF are actively managed funds of closed-end funds. Instead of picking individual bond funds, gold funds, or loan funds yourself, you’re buying a professionally constructed allocation.
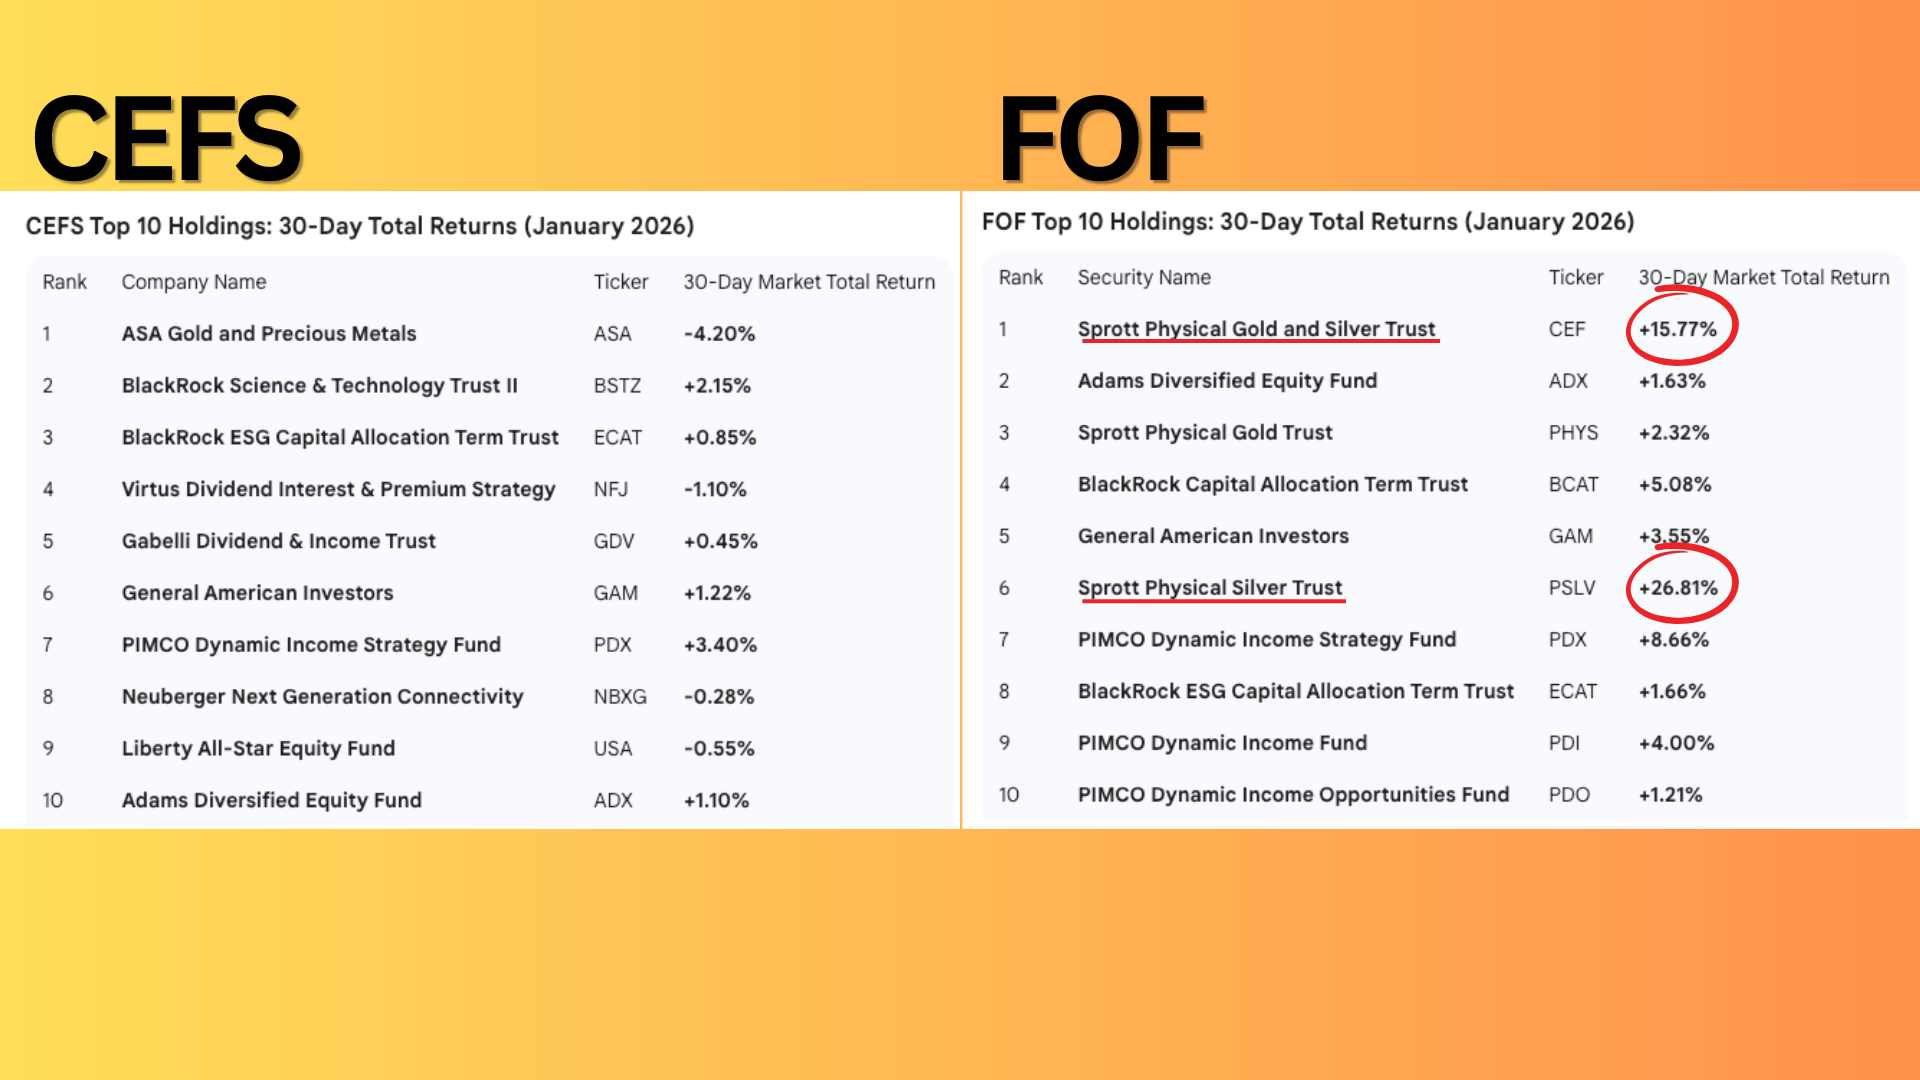
CEFS’s top ten holdings account for just over 50% of the portfolio. Precious metals represent the largest allocation, including a Canadian gold mining fund. As of January 2026, CEFS also held roughly 26% in cash, an unusually high level that reflects a more opportunistic approach.
FOF’s most recent portfolio shows a more typical cash position of around 3%. Precious metals are also prominent, but the exposure is different. FOF holds multiple positions in physical gold and silver trusts, rather than primarily mining companies.
That silver exposure turned out to matter—a lot.
The Activist Distinction
This is where CEFS truly separates itself.
CEFS is not just actively managed. It is also an activist investor. Through its management company, SABA, it takes significant ownership stakes in certain closed-end funds and works to unlock shareholder value.
This is not a passive strategy. It’s time-consuming, expensive, and occasionally controversial—but it’s also what allows CEFS to pursue returns that are not dependent on market direction.
For example, CEFS and SABA own 29% of ASA, a gold mining fund trading at roughly a 14% discount to net asset value. If that discount narrows through buybacks or structural changes, shareholders benefit. These efforts can take years, but when they work, they can generate capital gains—helping explain CEFS’s occasional special distributions.
FOF does not pursue activist strategies. It actively manages allocations, but it does not attempt to influence the funds it owns.
Performance, Fees, and Expectations
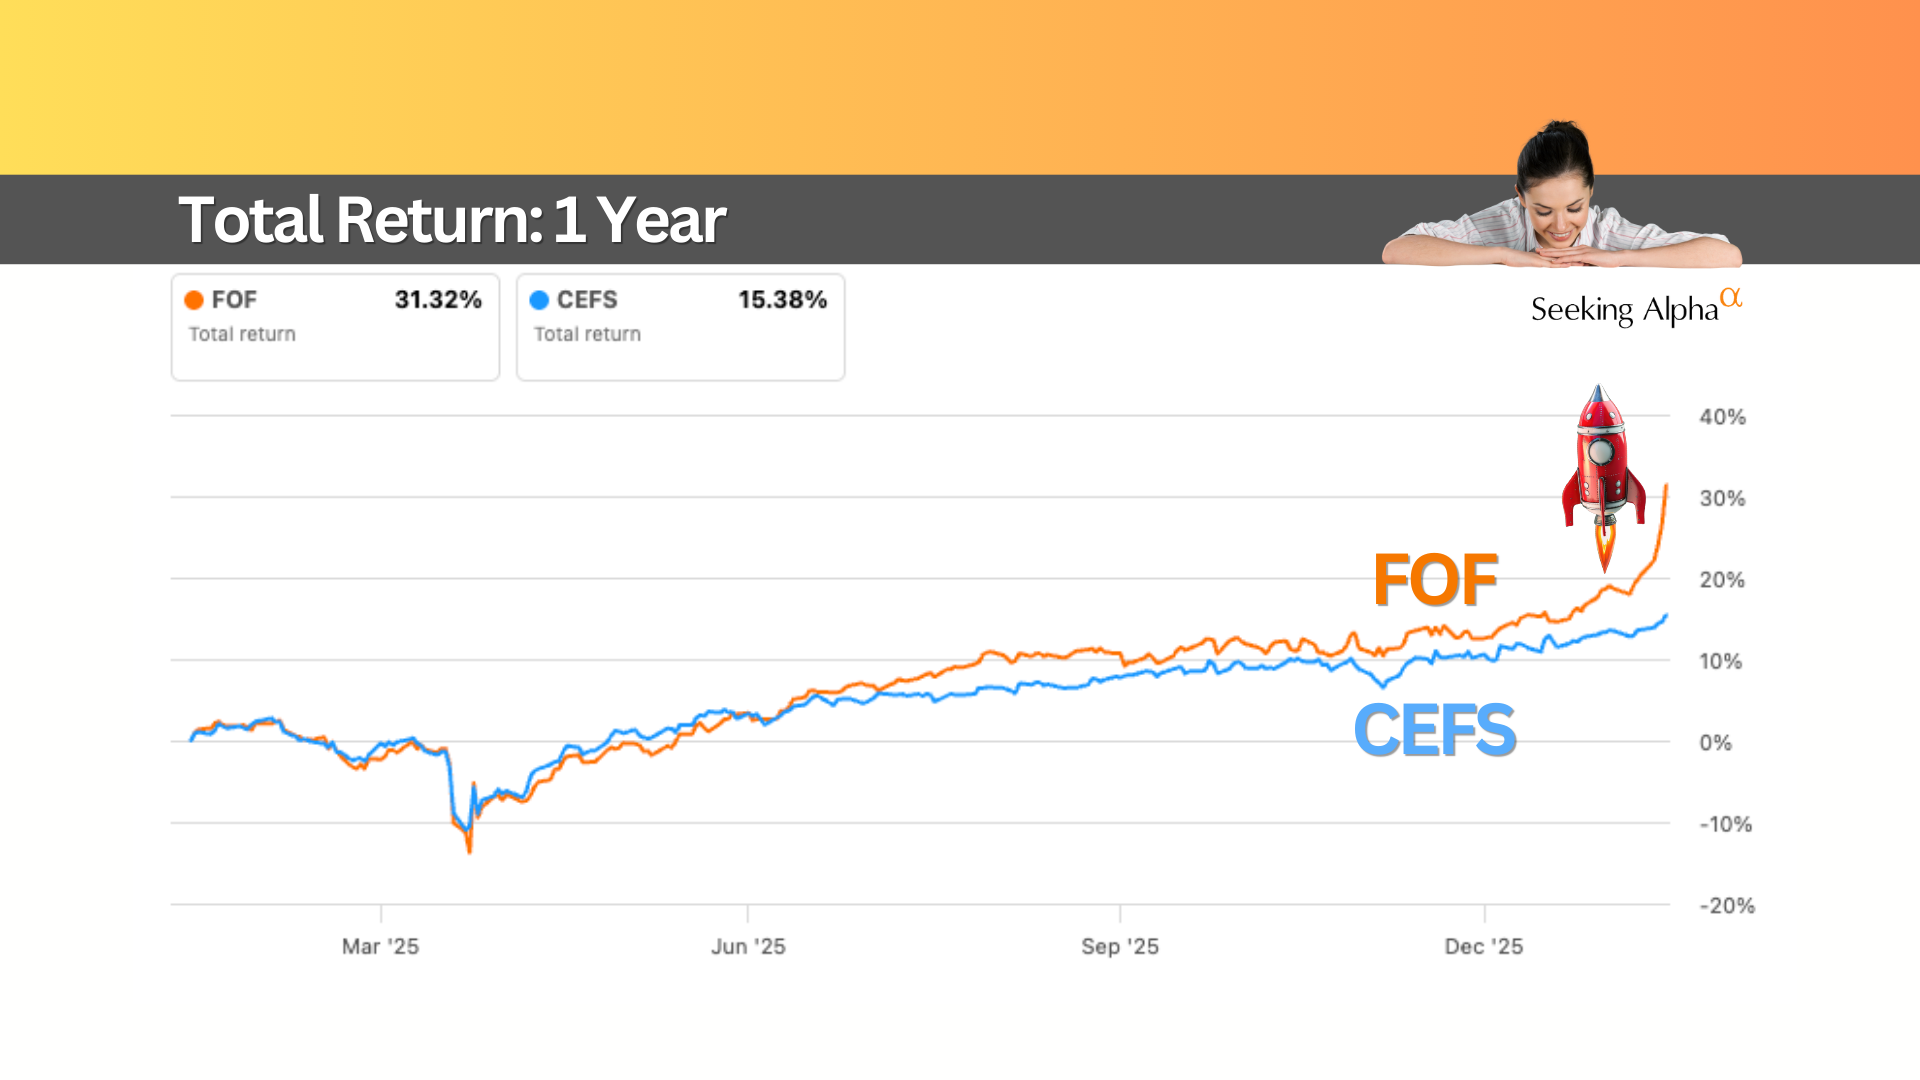
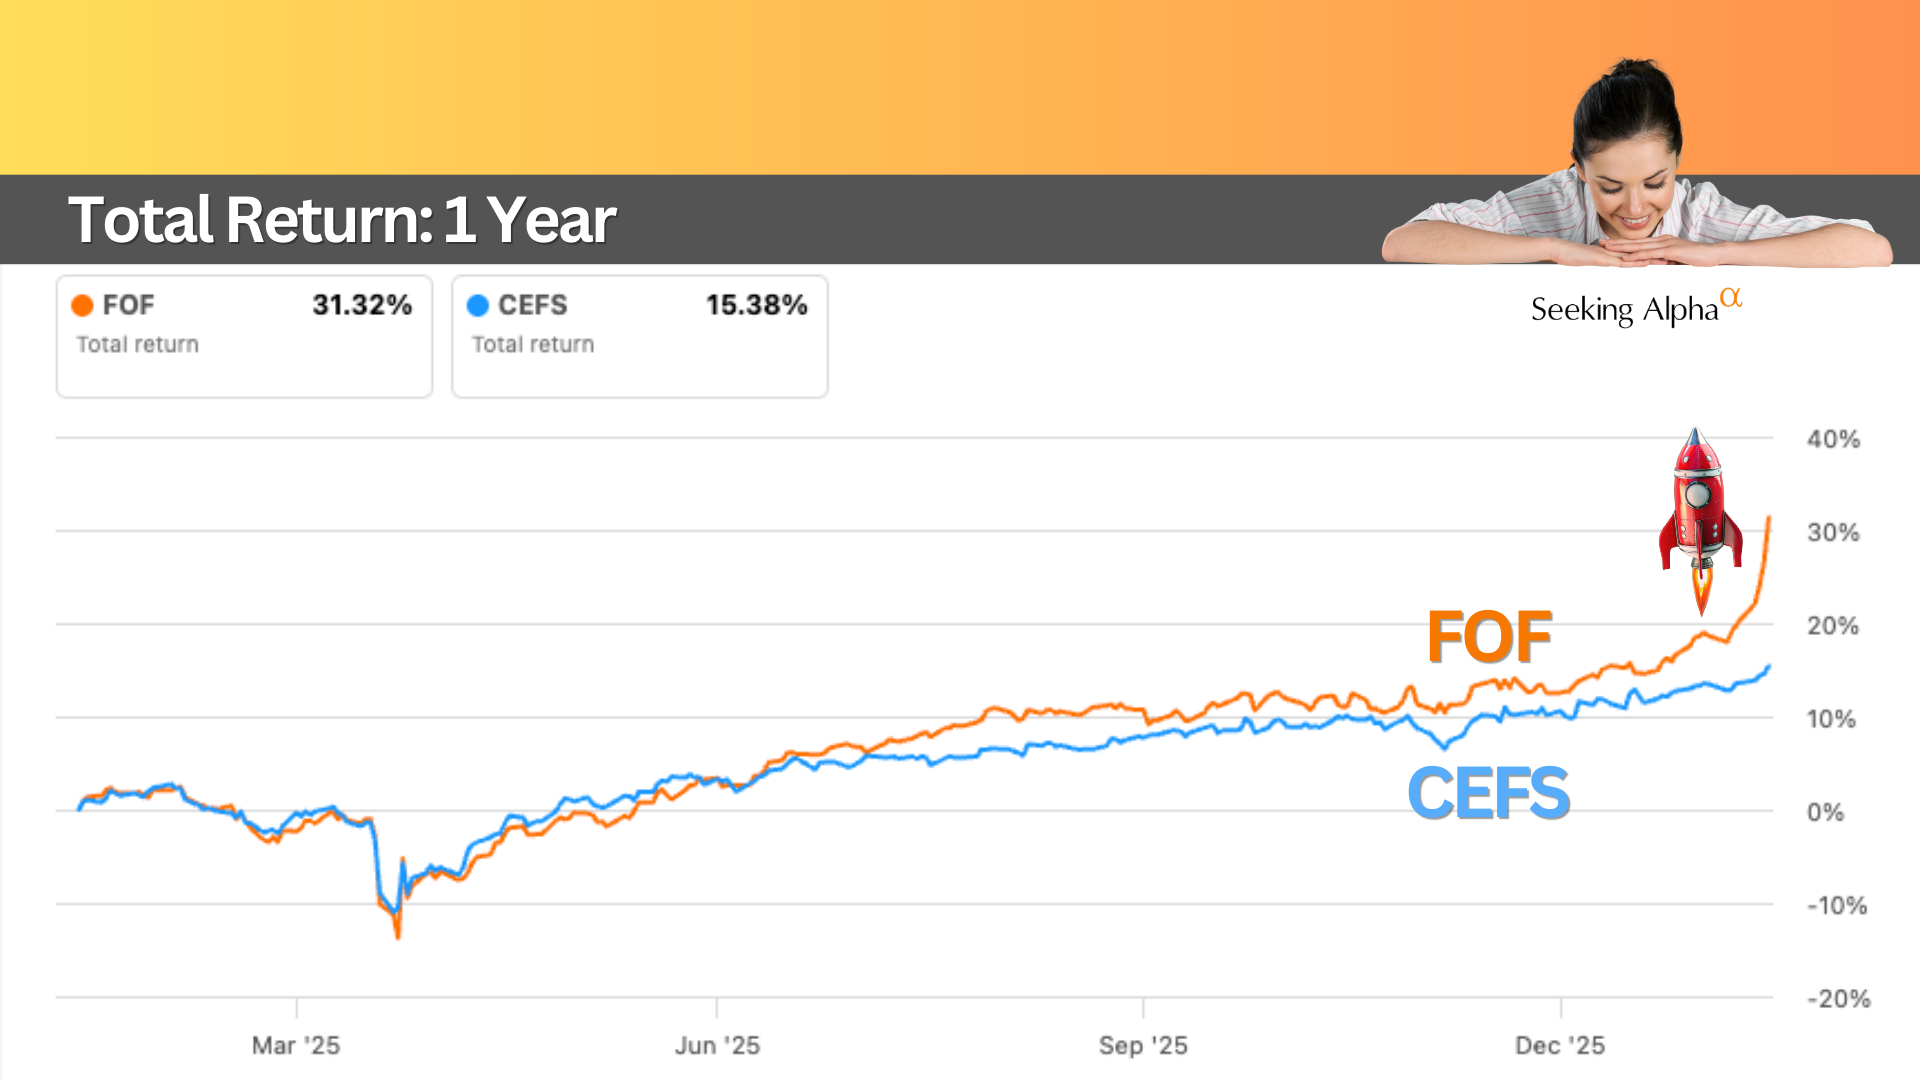
FOF recently outperformed, largely due to its exposure to silver during a strong rally. That tactical decision paid off. Over longer timelines, however, performance between the two funds has been much closer.
CEFS charges a 1.1% management fee, while FOF’s fee is slightly lower at 0.95%. Because both are funds of funds, additional expenses are embedded in the underlying holdings. The yield investors receive, is after those costs.
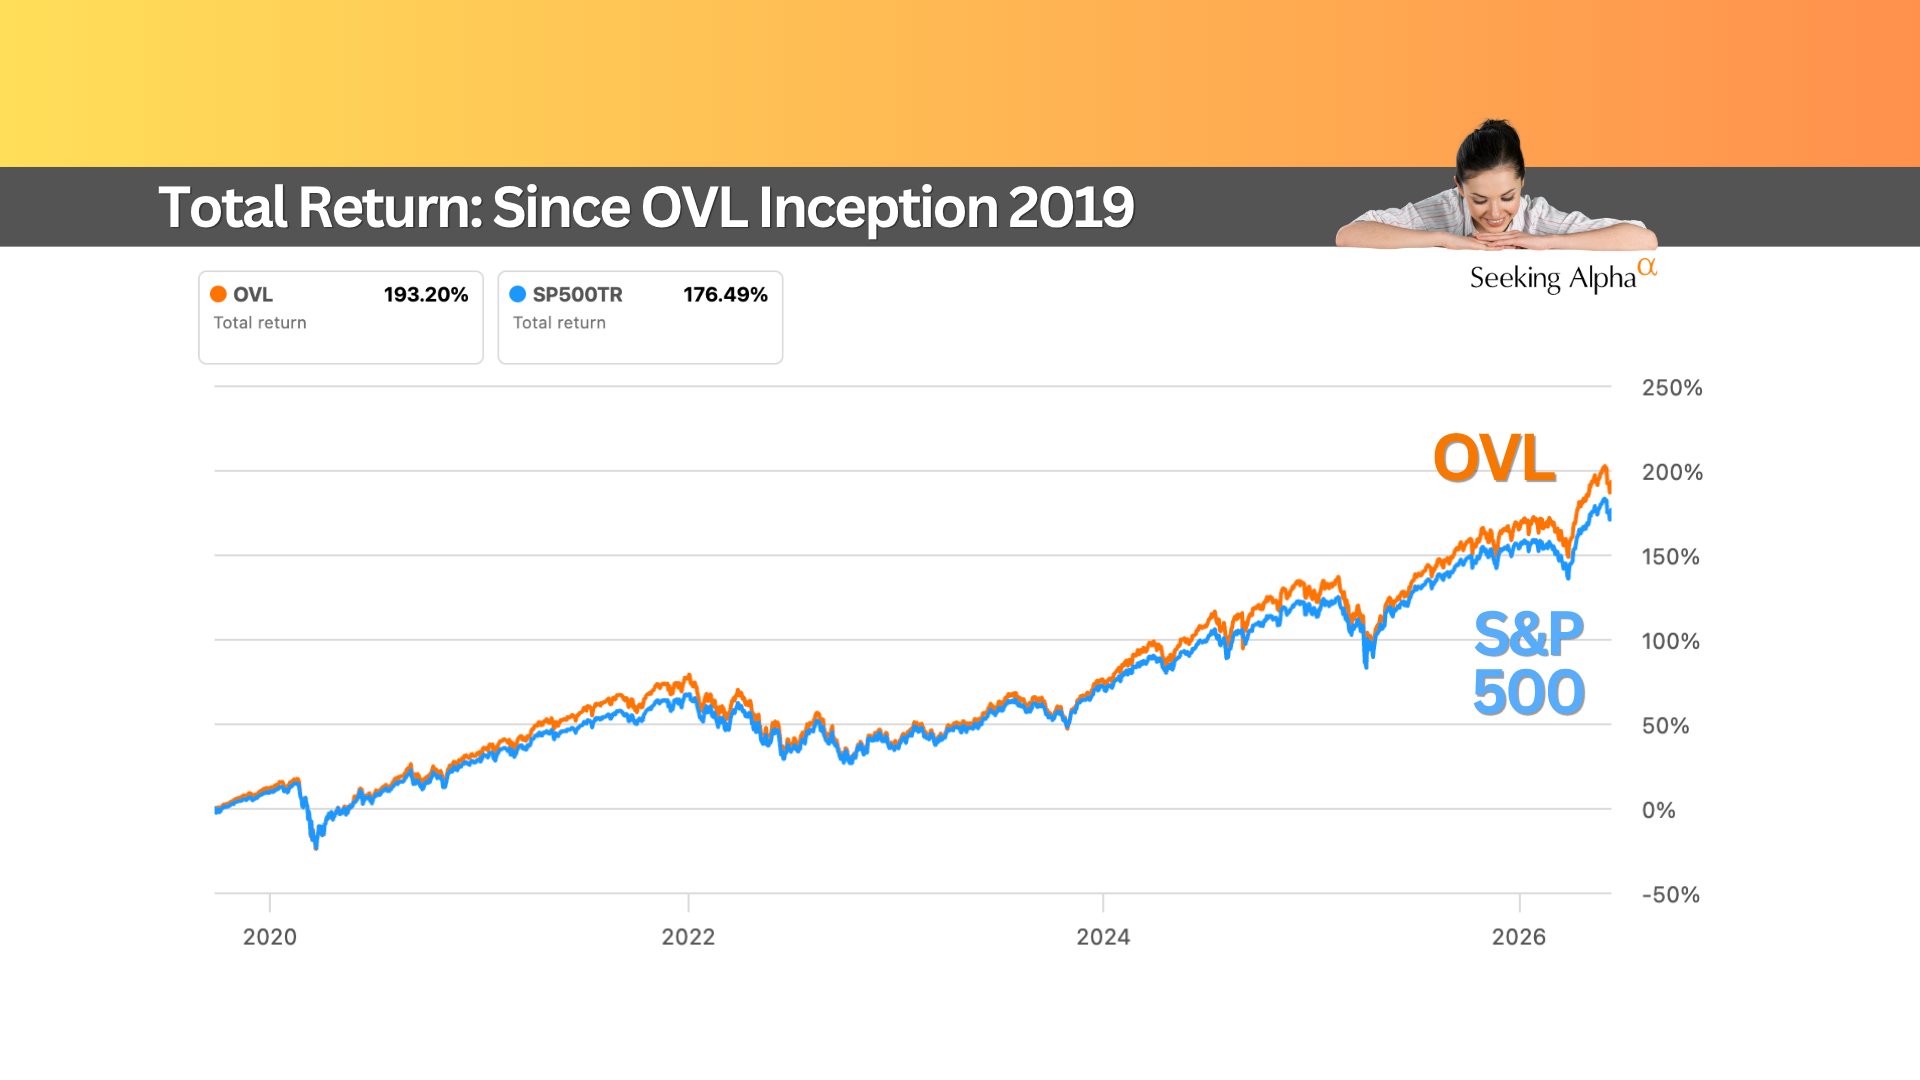
Neither fund is designed to track the S&P 500. Their role is diversification and steady income across asset classes.
Is This Right for You?
These funds are not meant to replace a fully customized income portfolio.
CEFS may appeal to investors who value the activist approach, and the potential upside from narrowing discounts, alongside consistent monthly income.
FOF may suit those who prefer a more traditional structure and direct exposure to physical precious metals.
No single fund truly does it all. These are diversified tools—useful, but not perfect. Click here for a full review of CEFS vs FOF.
(Disclosure: At the time of writing, I hold CEFS in my portfolio)
Want to see how these funds fit into a real-world retirement strategy? I share my full portfolio and monthly updates for free, here: Armchair Insider. If you want to learn from other Income Investors, check out the Armchair Insider Lounge.