
 Reaching Dividend Escape Velocity
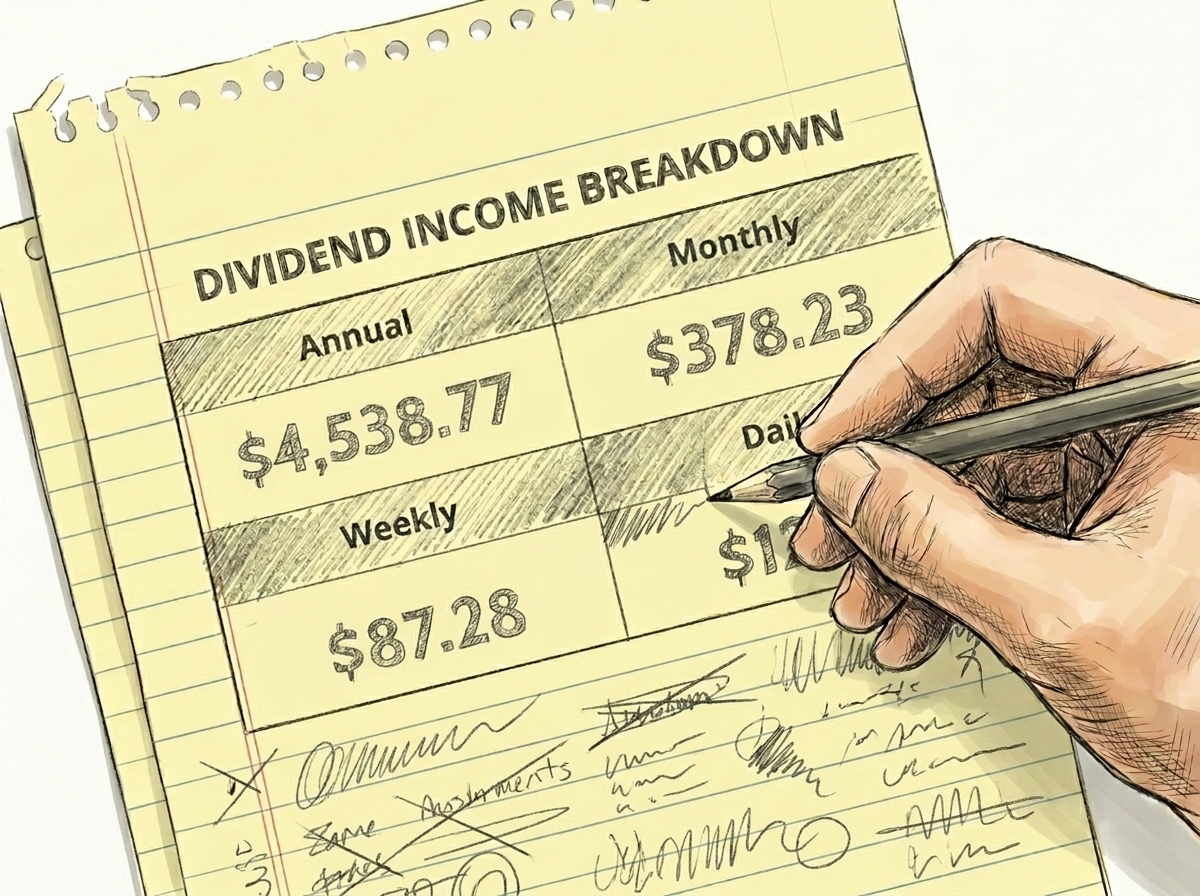
Imagine reaching a point where your dividends pay for everything so your rent/bills, food, travel, even the fun stuff and your portfolio keeps growing without you lifting a finger.
That’s Dividend Escape Velocity. The moment your investments earn enough to fund your entire lifestyle and keep outpacing inflation. It’s financial freedom powered by compounding.
Most investors aim to build wealth. But Dividend Escape Velocity is about living from it.
It’s when your dividend income covers your lifestyle and grows faster than inflation, so your freedom expands every year not shrinks.
 What It Means
It’s not just about covering bills once, true escape velocity happens when your dividend income grows faster than inflation meaning your spending power increases every year.
That’s when your money starts working harder than you do.
 How to Find Your Number
Step 1 — Know Your Lifestyle Cost
Add up what it takes to live your dream life (essentials + fun).
Example: £3,000/month = £36,000 per year.
Step 2 — Pick a Realistic Yield
Aim for around 4–5% from quality dividend-paying stocks.
Step 3 — Do the Math
£36,000 ÷ 0.05 = £720,000 portfolio needed to hit your escape velocity.
 Keep Your Income Growing
True escape velocity happens when dividend growth > inflation.
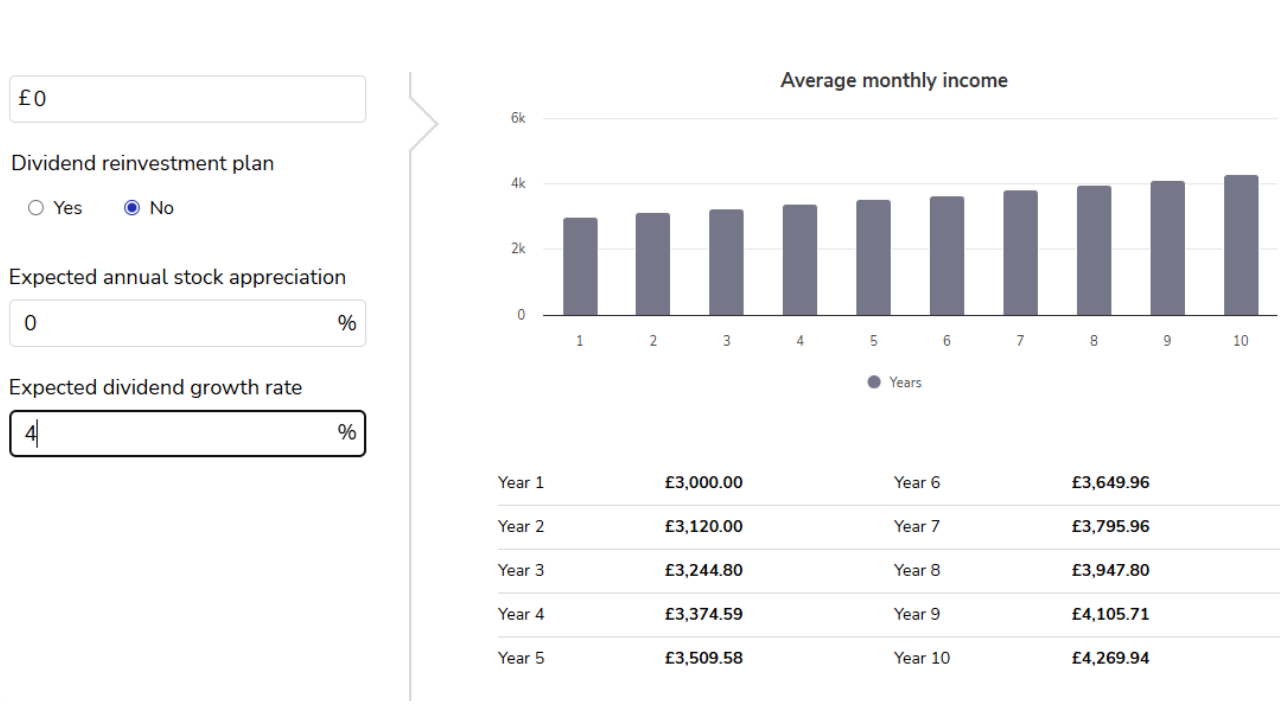
If your dividends rise 4% a year while inflation averages 2.5%, your income pulls away from rising costs. You can see on the example that by year 10 you will be receiving around £4270 and that’s assuming 0% annual stock appreciation with no reinvested dividends!
 My Own Target
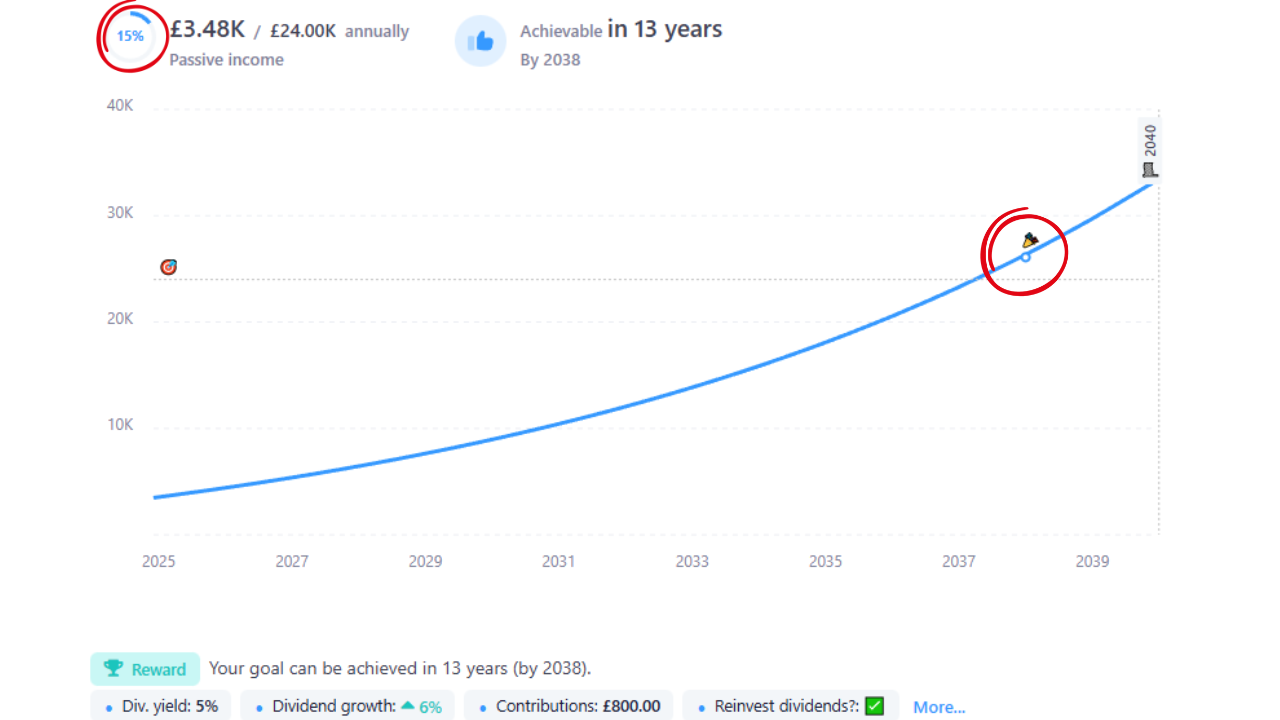
My Dividend Escape Velocity number is £24,000 per year (£2,000 per month).
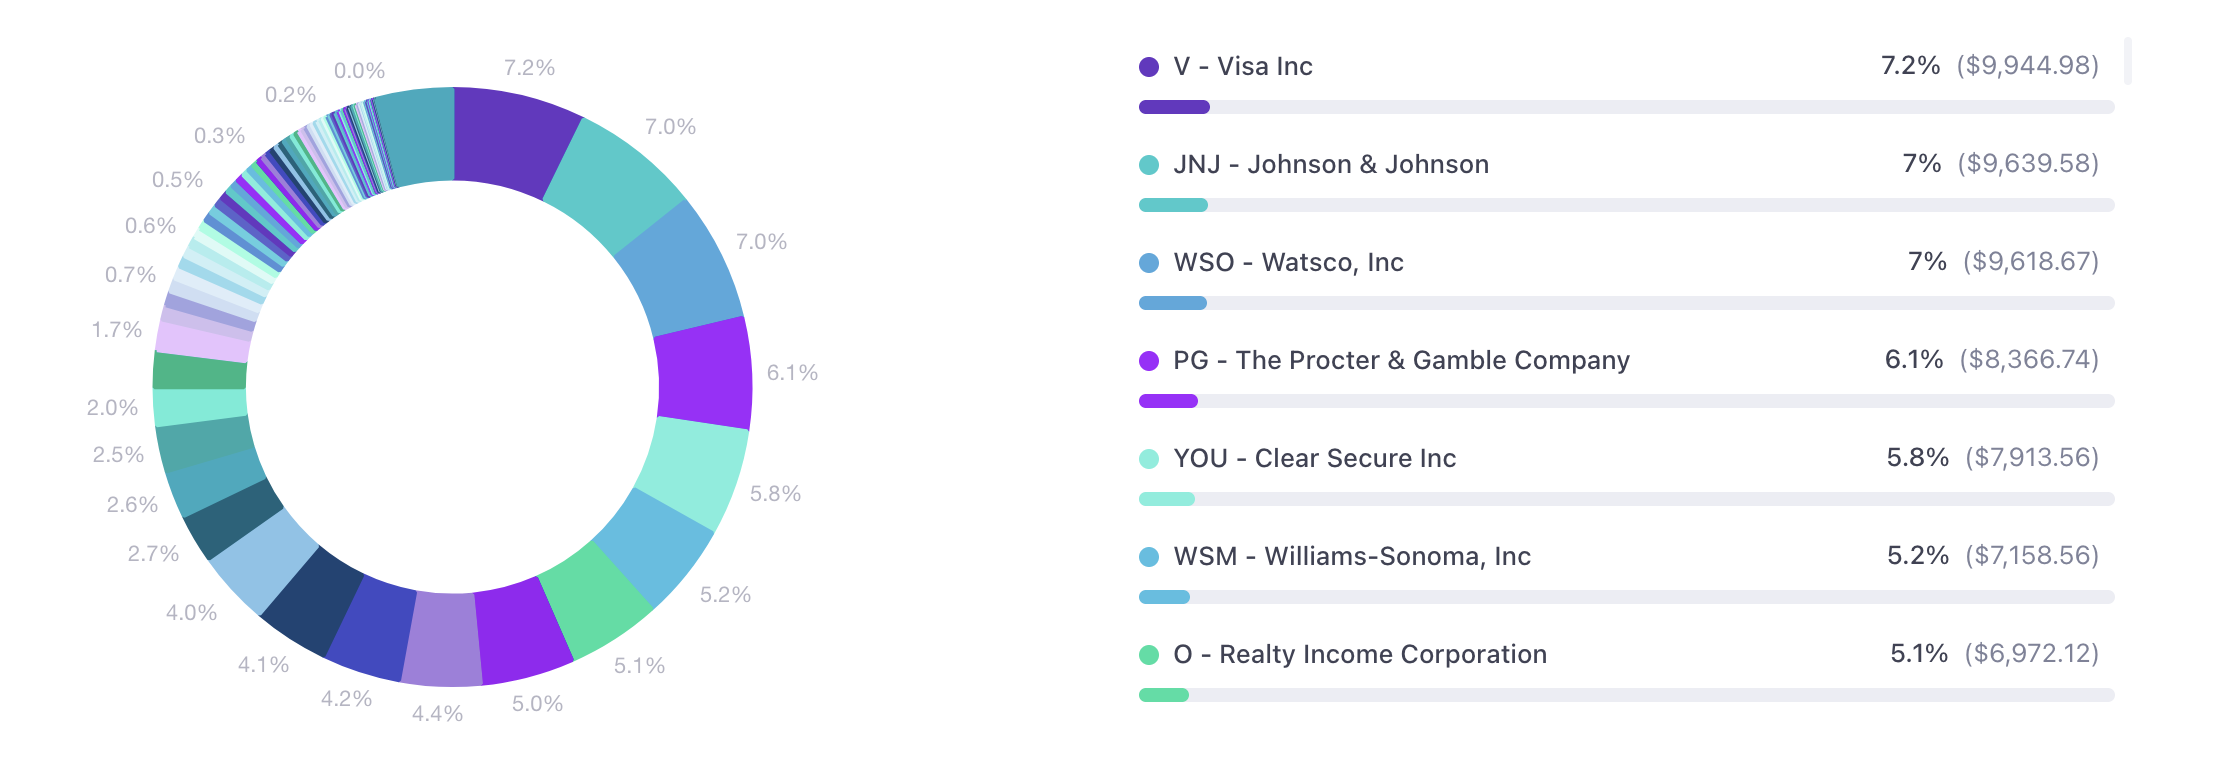
Using Snowball Analytics, I can see I’m already 15% of the way there thanks to their My Goal feature, which projects when I’ll reach that target based on real-time data. You can also see that it predicts i will hit it within the next 13 years.
 Why I Track Everything with Snowball
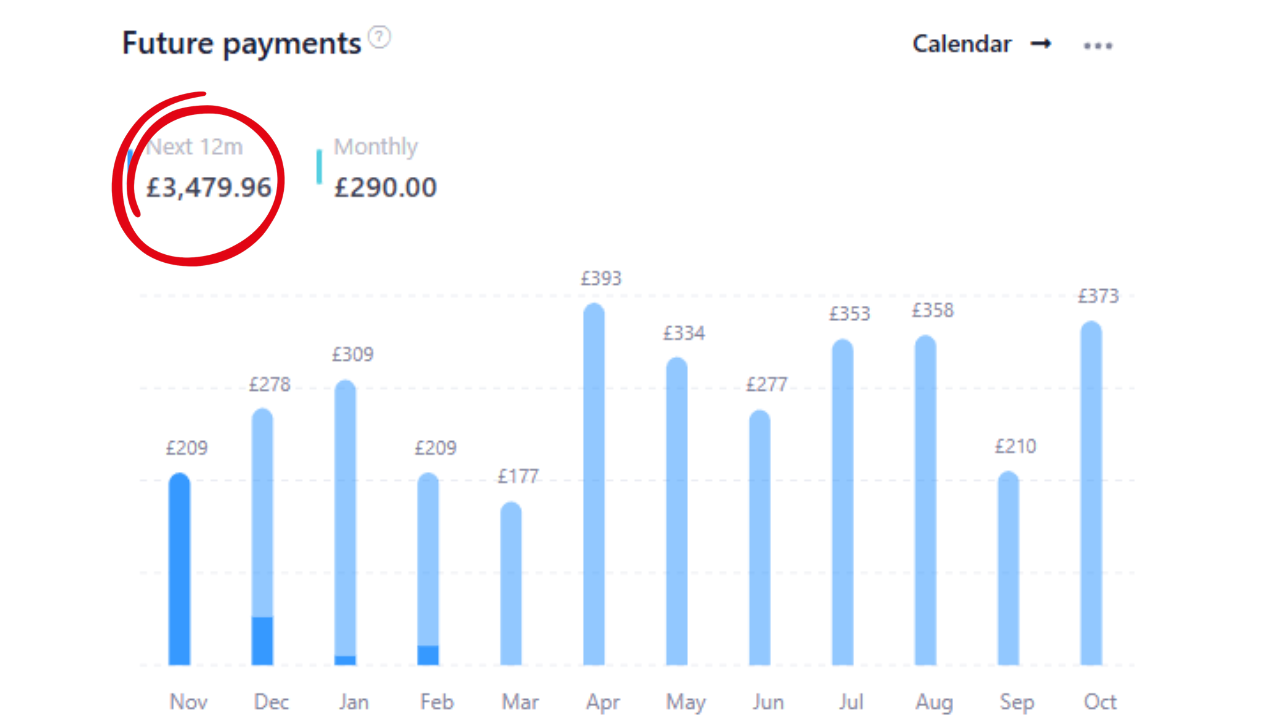
Snowball Analytics makes it simple to:
Track dividend income and growth
Visualize progress toward escape velocity
Model how changes in yield or contributions impact your goal
It’s my personal dashboard for financial freedom, seeing those graphs rise keeps me consistent and motivated.
 What’s Your Dividend Escape Velocity?
Now that you understand how it works, I’d love to hear what your number is so please drop it in the comments below!
 If you want to dive deeper, check out my full YouTube video on Dividend Escape Velocity — I break down the concept visually and show real examples using Snowball Analytics.
 https://youtu.be/fAK-RCVtwAs?si=-UXcNSNbIk39M_eL
Enjoyed this post?
This is my first Snowball Analytics blog so If you liked this post and want to see more on here then please let me know in the comments!
If you want to see more of my content like dividend investing breakdowns, portfolio updates, and financial freedom strategies then make sure to check out my YouTube channel:
https://youtube.com/@thegeordiepig?si=CXpG9Dl2lTPFr7np